empty
14.11.2023 12:10 PM
EUR/USD. November 14th. American inflation could wake the market up

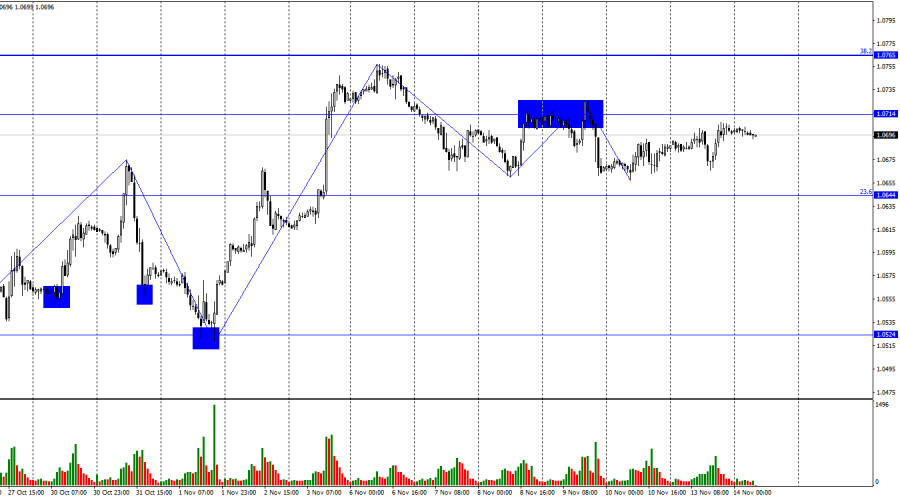
The EUR/USD pair continued a weak upward movement towards the level of 1.0714 on Monday. Despite this level being only 25 points above the day's opening level, it still needs to be reached. Today, a rebound from this level will work in favor of the American currency and resume the decline toward the corrective level of 23.6% (1.0644). Consolidating the pair's rate above 1.0714 increases the probability of further growth towards the next Fibonacci level of 38.2%–1.0765.

This image is no longer relevant

The wave situation remains ambiguous. The recent downward wave did not break the low of the previous wave, and the recent upward wave did not break the peak of the previous wave. Thus, concluding the dominance of bulls or bears is currently impossible. For over a month, we have observed a movement often called horizontal. Short-term trends consisting of 1–3 waves are formed occasionally, but they do not change the essence of the movement. On higher timeframes, it is seen that the movement is almost horizontal.

This week's news background will not be the strongest, but on Tuesday, several reports could slightly stir the market, which has been dormant for a week. The ZEW Economic Sentiment Index has little chance of doing this, but American inflation is much more interesting. Traders expect it to slow down to 3.3%, which will convince the FOMC of the correctness of the chosen path and further reduce the market's confidence in a new tightening of monetary policy. If inflation for October drops below 3.5%, the dollar may come under pressure. However, inflation is less important for traders now, as the Fed needs to send strong signals about being ready to raise interest rates even more. This report has a good chance of causing a market movement, but it may need to be revised.

This image is no longer relevant

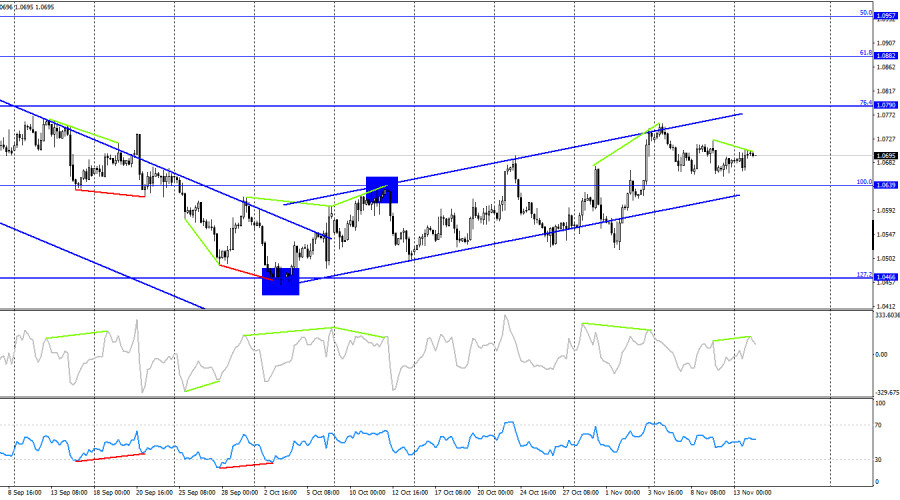
On the 4-hour chart, the pair reversed in favor of the European currency, and a new consolidation occurred above the corrective level of 100.0% (1.0639). A new "bearish" divergence of the CCI indicator favored the US currency, allowing the decline to continue towards 1.0639. Closing the pair's rate below this level will allow us to expect further decline towards the next Fibonacci level of 127.2%–1.0466. No new imminent divergences are observed at this time.

Commitments of Traders (COT) report:

This image is no longer relevant

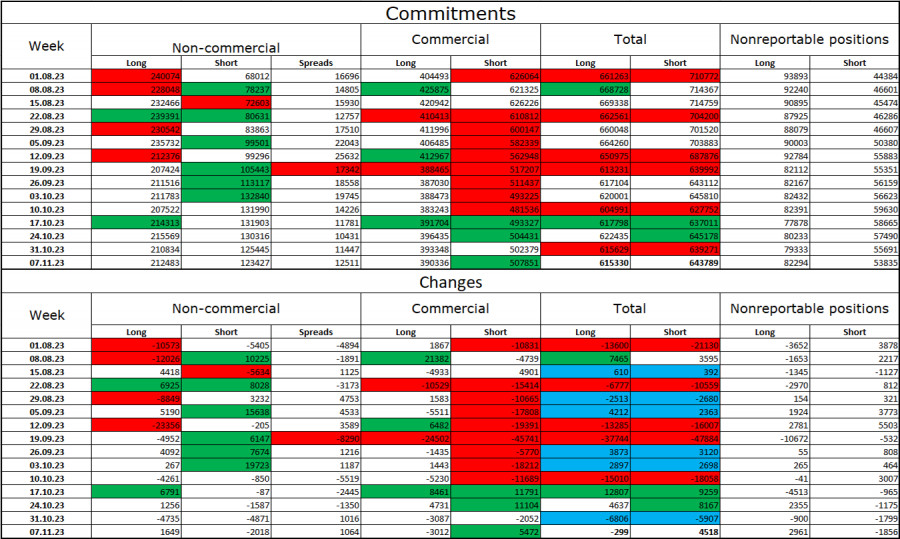
In the last reporting week, speculators opened 1649 long contracts and closed 2018 short contracts. The sentiment of major traders remains "bullish" but has noticeably weakened in recent weeks and months. The total number of long contracts speculators hold is 212 thousand, and short contracts are 123 thousand. The difference is already less than double, although a few months ago, the gap was threefold. The situation will continue to change in favor of bears. Bulls have dominated the market for too long, and now they need strong news to start a new "bullish" trend. Such a background currently needs to be present. Professional traders may continue to close long positions soon. The current figures allow for continuing the euro's decline in the coming months.

News Calendar for the US and the European Union:

European Union – ZEW Economic Sentiment Index in Germany (10:00 UTC).

European Union – GDP in the third quarter (10:00 UTC).

US – Consumer Price Index (CPI) (13:30 UTC).

On November 14, the economic events calendar contains at least two important entries. The impact of the news background on traders' sentiment on Tuesday may be of moderate strength.

EUR/USD Forecast and Trader Tips:

I do not recommend considering purchasing the pair at this time. There are no signals to buy now, and the movement is horizontal. I advised selling on consolidation below the level of 1.0714, with a target of 1.0644 and below. These trades can be kept open. It is also possible to sell on new rebounds from the level of 1.0714 with the same target.

เลือกช่วงเวลา
5
นาที
15
นาที
30
นาที
1
ชั่วโมง
4
ชั่วโมง
1
วัน
1
สัปดาห์
รับผลกำไรจากการเปลี่ยนแปลงอัตราสกุลเงินดิจิทัลกับ InstaForex.
ดาวน์โหลด MetaTrader 4 และเปิดการซื้อขายครั้งแรกของคุณ.
  • Grand Choice
    Contest by
    InstaForex
    InstaForex always strives to help you
    fulfill your biggest dreams.
    เข้าร่วมการแข่งขัน


บทความแนะนำ

การคาดการณ์ค่าเงิน Forex 07/05/2025: EUR/USD, USDX, SP500, ทองคำ และ Bitcoin

ลิงก์ที่มีประโยชน์: บทความอื่นๆ ของฉันสามารถอ่านได้ในส่วนนี้ คอร์ส InstaForex สำหรับผู้เริ่มต้น การวิเคราะห์ยอดนิยม เปิดบัญชีซื้อขาย คำสำคัญ: ผู้เริ่มต้นในตลาด forex จำเป็นต้องระมัดระวังอย่างมากในการตัดสินใจเข้าสู่ตลาด ก่อนการประกาศรายงานสำคัญ แนะนำให้อยู่ห่างจากตลาดเพื่อหลีกเลี่ยงการติดอยู่ในภาวะตลาดที่ผันผวนสูงซึ่งเกิดจากความผันผวนที่เพิ่มขึ้น หากคุณตัดสินใจซื้อขายในช่วงการประกาศข่าว

Sebastian Seliga 11:04 2025-05-07 UTC+2

EUR/USD – 7 พฤษภาคม: กราฟชี้ว่ากระทิงกำลังย้อนแนวโน้ม

ในวันอังคาร, คู่ EUR/USD กลับเป็นในภาคผู้สนับสนุนของยูโรและพุ่งขึ้นไปยังโซนต้านทานที่ 1.1374–1.1383 การเด้งกลับจากโซนนี้ทำให้เกิดการลดลงในภาคผู้สนับสนุนของดอลลาร์สหรัฐฯ, โดยที่คู่นั้นกลับไปตกที่ระดับของการชะลอในรภาพของ Fibonacci ที่ 100.0% ที่ 1.1265 นี่คือวันที่หกที่มีการซื้อขายระดับต่อเนื่องระหว่าง 1.1265

Samir Klishi 10:56 2025-05-07 UTC+2

GBP/USD – วันที่ 7 พฤษภาคม: ความไม่แน่นอนในระดับโลกและ FOMC

บนแผนภูมิชั่วโมง, คู่ GBP/USD ในวันอังคารผันตัวเป็นฝ่ายของปอนด์สหราชอาณาจักรและปิดสูงกว่าโซนความต้านทานที่ 1.3344–1.3357 ดังนั้น, การเด้งที่สมบูรณ์จากโซนนี้วันนี้อาจนำไปสู่การเคลื่อนไหวขึ้นยังต่ออาจนำไปสู่การเคลื่อนไหวขึ้นยังต่อไปที่ระดับ 1.3425 อย่างไรก็ตาม, การที่มีการรวมกันอยู่ใต้โซนนี้จะสนับสนุนดอลลาร์สหราชอาณาจักรและดำเนินการลดลงต่อไปยังระดับ 100.0% ของ Fibonacci ที่ 1.3205

Samir Klishi 10:52 2025-05-07 UTC+2

การวิเคราะห์ทางเทคนิคของการเคลื่อนไหวราคาภายในวันของคู่เงินครอส AUD/JPY, วันพุธที่ 7 พฤษภาคม 2025

หากเราดูที่กราฟ 4 ชั่วโมงของคู่ค่าเงิน AUD/JPY จะเห็นรูปแบบ Descending Broadening Wedge ซึ่งรูปแบบนี้ให้สัญญาณว่าในอนาคตอันใกล้ AUD/JPY มีแนวโน้มที่จะแข็งค่าขึ้นในทิศทางเหนือไปทดสอบระดับ 93.52 ในอนาคตอันใกล้นี้ หากระดับนี้ถูกทะลุและปิดเหนือระดับดังกล่าวได้ AUD/JPY

Arief Makmur 07:43 2025-05-07 UTC+2

การวิเคราะห์ทางเทคนิคของการเคลื่อนไหวราคาภายในวันของเครื่องมือสินค้าธรรมชาติก๊าซ วันพุธที่ 07 พฤษภาคม 2025

ในกราฟ 4 ชั่วโมง เครื่องมือการลงทุน Natural Gas แสดงให้เห็นถึงแบบแผนขาลง 123 ตามด้วย Ross Hook (RH) ขาลง และมีการยืนยันว่าการเคลื่อนไหวของราคาต่ำกว่า

Arief Makmur 07:43 2025-05-07 UTC+2

สัญญาณการเทรดสำหรับ EUR/USD สำหรับวันที่ 6-8 พฤษภาคม 2025: ขายต่ำกว่า 1.1370 (200 EMA - 6/8 Murray)

กราฟรายวันแสดงให้เห็นว่า EUR/USD กำลังซื้อขายต่ำกว่าช่องเทรนด์ขาลงที่เกิดขึ้นเมื่อวันที่ 17 เมษายนภายใต้แรงกดดันขาลง ยูโรอยู่ต่ำกว่า 1/8 Murray และต่ำกว่า 21 SMA ในทางเทคนิค ยูโรอ่อนล้า ดังนั้นมุมมองขาลงอาจยังคงมีผลต่อไปตราบที่ ER/USD

Dimitrios Zappas 17:50 2025-05-06 UTC+2

สัญญาณการซื้อขายสำหรับทองคำ (XAU/USD) ระหว่างวันที่ 6-8 พฤษภาคม 2025: ขายต่ำกว่าราคา $3,405 (21 SMA - 8/8 Murray)

ในช่วงเช้าของตลาดอเมริกา ทองคำซื้อขายอยู่ที่ประมาณ 3,381 หลังจากร่วงลงจากจุดสูงสุดที่ประมาณ 3,397 ทองคำในฐานะสินทรัพย์ปลอดภัยมีความวิตกเนื่องจากความตึงเครียดทางภูมิรัฐศาสตร์ที่เกิดขึ้นทั่วโลก ในทางเทคนิค ทองคำกำลังแสดงให้เห็นถึงแนวโน้มขาขึ้น ซึ่งอาจขึ้นไปสู่ระดับจิตวิทยาที่ $3,500 ในอีกไม่กี่วันข้างหน้าและอาจจะถึง +1/8 Murray ที่ตั้งอยู่ที่ 3,515

Dimitrios Zappas 17:49 2025-05-06 UTC+2

การพยากรณ์ฟอเร็กซ์ 06/05/2025: EUR/USD, GBP/USD, ทองคำ, น้ำมัน, SP500, NASDAQ และ Bitcoin

ลิงก์ที่เป็นประโยชน์: บทความอื่นๆ ของฉันมีอยู่ในส่วนนี้ หลักสูตรสำหรับผู้เริ่มต้นของ InstaForex การวิเคราะห์ยอดนิยม เปิดบัญชีซื้อขาย ข้อควรระวัง: ผู้เริ่มต้นในการซื้อขายฟอเร็กซ์ควรระมัดระวังเป็นพิเศษเมื่อทำการตัดสินใจเกี่ยวกับการเข้าสู่ตลาด ก่อนการเปิดเผยรายงานสำคัญ การหลีกเลี่ยงการเข้าตลาดจะดีที่สุดเพื่อหลีกเลี่ยงการเผชิญความผันผวนที่รุนแรงเนื่องจากความผันแปรที่เพิ่มขึ้น หากคุณตัดสินใจที่จะทำการค้าในระหว่างการเปิดเผยข่าว ควรวางคำสั่งหยุดการขาดทุนเสมอเพื่อจำกัดการสูญเสีย หากไม่ได้วางคำสั่งหยุดการขาดทุน คุณอาจสูญเสียเงินฝากทั้งก้อนอย่างรวดเร็ว

Sebastian Seliga 11:16 2025-05-06 UTC+2

EUR/USD. วันที่ 6 พฤษภาคม หมีทำทุกอย่างที่ทำได้แล้ว

ในวันจันทร์ คู่สกุลเงิน EUR/USD ได้เกิดการกลับตัวใหม่ในทิศทางที่เป็นผลดีแก่ดอลลาร์สหรัฐ แต่ครั้งนี้การขยับตัวลงยิ่งอ่อนแรงลง ในช่วงเวลาส่วนใหญ่ของสัปดาห์ที่ผ่านมา กลุ่มผู้ขายได้ทำการโจมตีที่ไม่ค่อยมีแรงสนับสนุน เนื่องจากถูกสวนกลับด้วยบรรยากาศข้อมูลเชิงลบจากสหรัฐอเมริกา รายงานส่วนใหญ่แสดงถึงสภาพเศรษฐกิจอเมริกาที่แย่ลง ทำให้ดอลลาร์สหรัฐแสดงการเติบโตได้ยากมาก ฉันไม่คาดว่าจะเห็นการลดลงต่ำกว่าระดับการแก้ไข 100.0% ที่ 1.1265 ในอนาคตอันใกล้นี้

Samir Klishi 10:30 2025-05-06 UTC+2

GBP/USD. วันที่ 6 พฤษภาคม จีนได้รับสิ่งที่สมควรแล้ว

ในกราฟรายชั่วโมง คู่เงิน GBP/USD ยังคงเคลื่อนไหวในทิศทางด้านข้างในวันจันทร์ การเคลื่อนไหวในทิศทางด้านข้างนี้เริ่มขึ้นตั้งแต่สัปดาห์ที่แล้วเมื่อมีการเผยแพร่ชุดรายงานสำคัญในสหรัฐฯ และนักลงทุนคาดหวังว่าจะมีการซื้อขายที่เข้มข้นมากขึ้น อย่างไรก็ตาม รายงานส่วนใหญ่ถูกมองว่าไม่มีนัยสำคัญภายใต้สถานการณ์ปัจจุบัน และเทรดเดอร์ยังคงจับตาดูการแถลงข่าวของโดนัลด์ ทรัมป์อย่างใกล้ชิด โดยคาดหวังว่าจะมีการลดความตึงเครียดในความขัดแย้งระหว่างสหรัฐฯ และจีน ในช่วงที่ขาดข่าวสาร เทรดเดอร์มักไม่กระทำการใด

Samir Klishi 10:25 2025-05-06 UTC+2
หากไม่สะดวกคุยในตอนนี้
ระบุคำถามไว้ได้ใน แชท.
Widget callback
 

Dear visitor,

Your IP address shows that you are currently located in the USA. If you are a resident of the United States, you are prohibited from using the services of InstaFintech Group including online trading, online transfers, deposit/withdrawal of funds, etc.

If you think you are seeing this message by mistake and your location is not the US, kindly proceed to the website. Otherwise, you must leave the website in order to comply with government restrictions.

Why does your IP address show your location as the USA?

  • - you are using a VPN provided by a hosting company based in the United States;
  • - your IP does not have proper WHOIS records;
  • - an error occurred in the WHOIS geolocation database.

Please confirm whether you are a US resident or not by clicking the relevant button below. If you choose the wrong option, being a US resident, you will not be able to open an account with InstaForex anyway.

We are sorry for any inconvenience caused by this message.