empty
24.03.2025 08:55 AM
EUR/USD and GBP/USD March 24 – Technical Analysis

EUR/USD

This image is no longer relevant

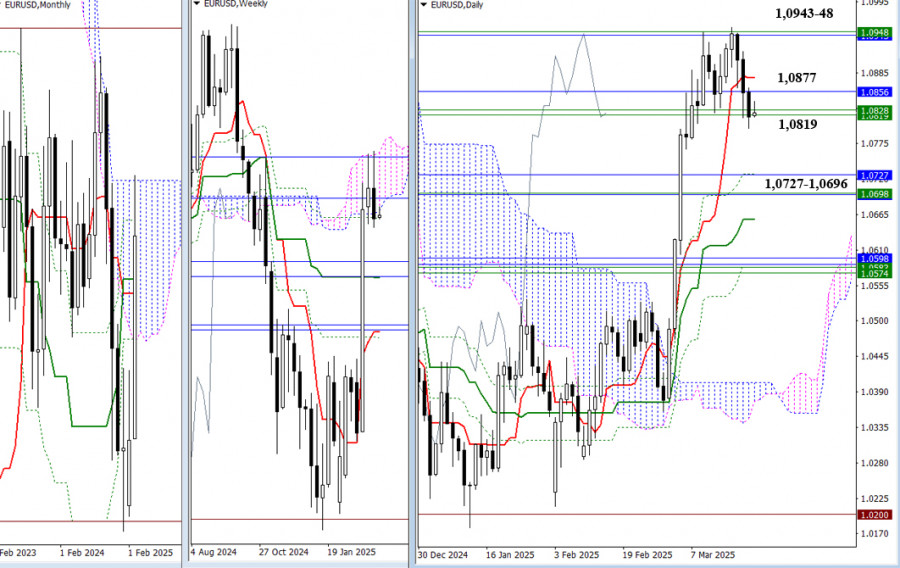
Recently, the pair has been testing resistance levels from the weekly Ichimoku cloud (1.0946–1.0825) and monthly levels (1.0943–1.0856). Last week, sellers initiated a rejection and closed below these resistance zones. As a result, the main task for the bears now is to confirm and extend this rejection. If successful, their focus will shift to the cluster of supports around 1.0727–1.0696 (monthly Tenkan + Kijun, weekly Kijun, and daily levels). If sellers fail to maintain control, consolidation may develop around the current support area (1.0877–1.0819). In this case, buyers could regain the initiative at any moment, aiming once again for the upper boundaries of the monthly (1.0943) and weekly (1.0948) Ichimoku clouds.

This image is no longer relevant

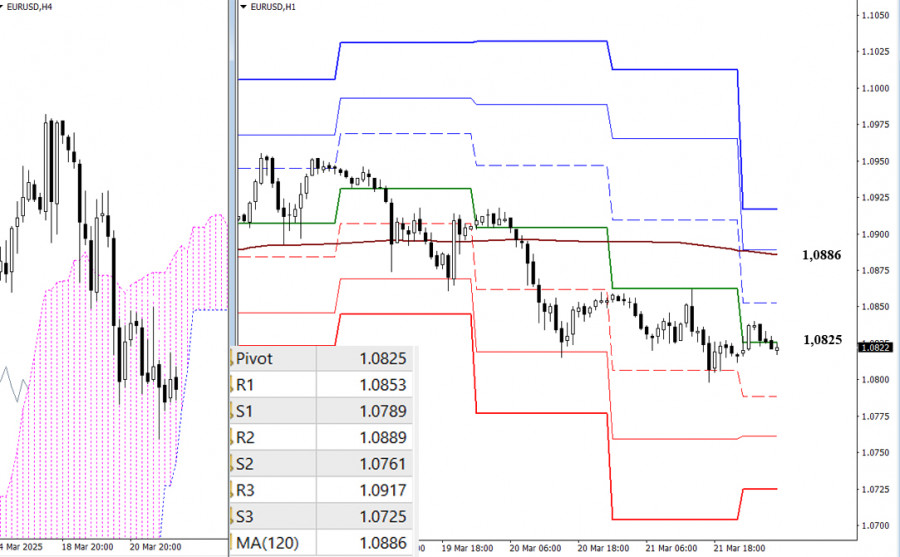
On the lower timeframes, sellers currently maintain the upper hand. A continuation of the decline today is possible through a break below the classic Pivot support levels (1.0789 – 1.0761 – 1.0725). If buyers extend the ongoing correction, the key focus will be testing and breaking the weekly long-term trend level (1.0886). A trend reversal at that level would shift the balance of power, giving intraday buyers access to the following targets at the classic Pivot resistance levels (1.0889 – 1.0917).

***

GBP/USD

This image is no longer relevant

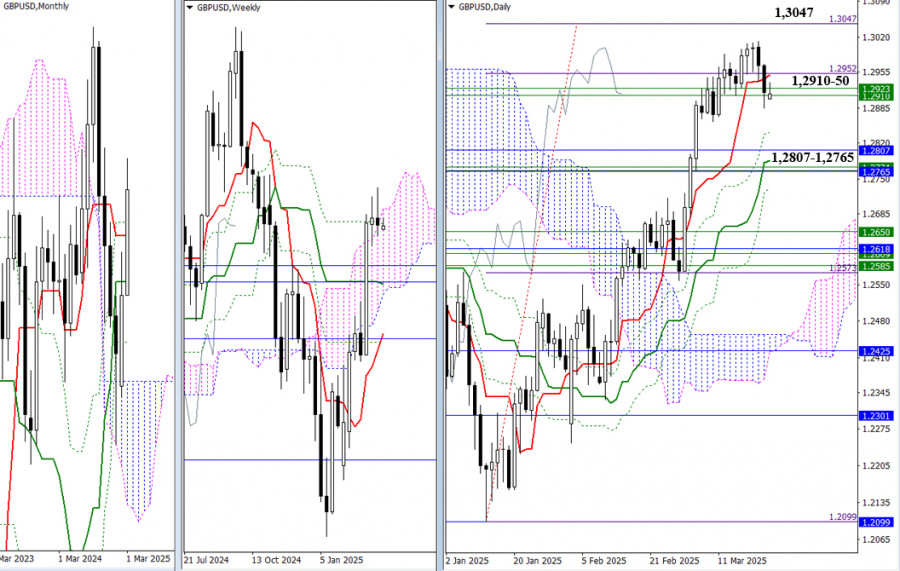
For the past two weeks, the market has remained indecisive, hovering around the area of the daily short-term trend (1.2950) and weekly levels (1.2910–1.2923). For the bulls, the target of breaking through the daily Ichimoku cloud (1.3047) remains unfulfilled. If bears are the first to exit this zone of uncertainty, the next downside target will be the cluster of supports near the monthly levels (1.2807–1.2765).

This image is no longer relevant

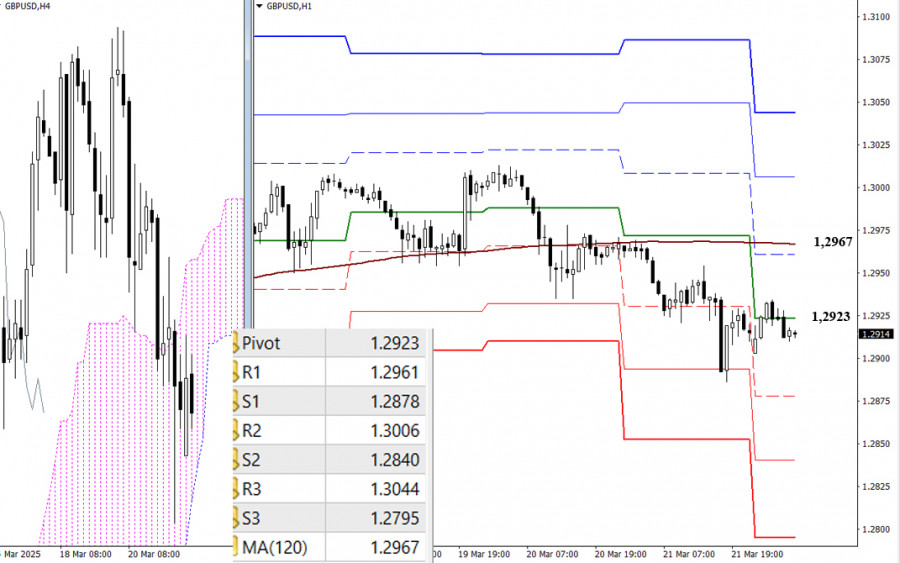
At the moment, sellers have the main advantage on the lower timeframes. Intraday support targets for further downside can be noted at 1.2878 – 1.2840 – 1.2795. The current balance of power can only be altered by a break and reversal of the weekly long-term trend level (1.2967). If buyers consolidate above this level and gain the upper hand, today's targets will be the classic Pivot resistance levels (1.3006 – 1.3044).

***

Technical Analysis Components:
  • Higher Timeframes: Ichimoku Kinko Hyo (9.26.52) and Fibonacci Kijun levels
  • H1: Classic Pivot Points and 120-period Moving Average (weekly long-term trend)
Evangelos Poulakis,
Especialista em análise na InstaForex
© 2007-2025
Selecionar intervalo de tempo
5
min
15
min
30
min
1
hora
4
horas
1
dia
1
s.
Ganhe com as variações das taxas das criptomoedas com a InstaForex.
Baixe o MetaTrader 4 e abra a sua primeira operação.
  • Grand Choice
    Contest by
    InstaForex
    InstaForex always strives to help you
    fulfill your biggest dreams.
    PARTICIPE DO CONCURSO

Recommended Stories

Análise técnica do movimento intradiário de preços do #CL, terça-feira, 06 de maio de 2025

Com a formação de um padrão de preço caracterizado por mínimos mais baixos e máximos mais altos, aliado à inclinação descendente da WMA (30, deslocamento 2) e ao fato

Arief Makmur 15:52 2025-05-06 UTC+2

Análise técnica do movimento intradiário de preços do GBP/AUD, terça-feira, 06 de maio de 2025

No gráfico de 4 horas, o par cruzado GBP/AUD ainda parece estar sob domínio dos vendedores, como indica o movimento de preços abaixo da WMA (30, deslocamento 2). No entanto

Arief Makmur 15:37 2025-05-06 UTC+2

GBP/USD. 6 de maio. A China teve o que merecia

No gráfico horário, o par GBP/USD continuou a ser negociado lateralmente na segunda-feira. O movimento lateral começou na semana passada, quando uma série de relatórios importantes foi divulgada nos E.U

Samir Klishi 15:05 2025-05-06 UTC+2

Sinais de negociação para EUR/USD para 5-8 de maio de 2025: venda abaixo de 1,1370 (EMA 200 - 6/8 de Murray)

A perspectiva geral permanece negativa para o euro, e há possibilidade de queda até o nível psicológico de 1,1000, que coincide com o nível 5/8 de Murray no curto prazo

Dimitrios Zappas 21:15 2025-05-05 UTC+2

Sinais de negociação para o OURO (XAU/USD) para 5-8 de maio de 2025: comprar acima de $3.305 (SMA 21 - 7/8 de Murray)

Por outro lado, uma fraqueza no metal abaixo da SMA 21 em 3.280 poderia retomar o ciclo de baixa. Portanto, podemos esperar que o ouro atinja a parte inferior

Dimitrios Zappas 21:06 2025-05-05 UTC+2

EUR/USD. Os resultados da reunião do Fed podem levar o par a uma queda

O par está se consolidando em uma faixa estreita abaixo do nível de resistência de 1,1345, em antecipação ao resultado da reunião de política monetária do Fed, que será concluída

Pati Gani 20:56 2025-05-05 UTC+2

Análise técnica do movimento intradiário do preço do ouro, segunda-feira, 05 de maio de 2025

Com o surgimento do padrão Cunha Descendente no gráfico de 4 horas, há indicação de que o ouro tem potencial para subir até o nível de 3.297,43 no curto prazo

Arief Makmur 17:56 2025-05-05 UTC+2

Análise técnica do movimento intradiário de preços do EUR/JPY, segunda-feira, 05 de maio de 2025

Ao analisar o gráfico de 4 horas do par EUR/JPY, observa-se um potencial de fortalecimento no curto prazo. Esse cenário é corroborado pela formação de um padrão de convergência entre

Arief Makmur 17:37 2025-05-05 UTC+2

GBP/USD – 5 de maio: Trump pode suspender as tarifas sobre a China

No gráfico horário, o par GBP/USD continuou sua queda na sexta-feira em direção ao nível de correção Fibonacci de 161,8%, em 1,3249. Uma recuperação a partir deste nível favorecerá

Samir Klishi 15:24 2025-05-05 UTC+2

EUR/USD – 5 de maio: O mercado de trabalho dos EUA não está sem esperanças

Na sexta-feira, o par EUR/USD subiu para o nível 1,1374, se recuperou e reverteu a favor do dólar americano. Os ursos atacaram novamente, mas apenas brevemente, e, em geral, permaneceram

Samir Klishi 14:55 2025-05-05 UTC+2
Não pode falar agora?
Faça sua pergunta no chat.
Widget callback
 

Dear visitor,

Your IP address shows that you are currently located in the USA. If you are a resident of the United States, you are prohibited from using the services of InstaFintech Group including online trading, online transfers, deposit/withdrawal of funds, etc.

If you think you are seeing this message by mistake and your location is not the US, kindly proceed to the website. Otherwise, you must leave the website in order to comply with government restrictions.

Why does your IP address show your location as the USA?

  • - you are using a VPN provided by a hosting company based in the United States;
  • - your IP does not have proper WHOIS records;
  • - an error occurred in the WHOIS geolocation database.

Please confirm whether you are a US resident or not by clicking the relevant button below. If you choose the wrong option, being a US resident, you will not be able to open an account with InstaForex anyway.

We are sorry for any inconvenience caused by this message.