empty
28.12.2022 01:53 PM
U.S. Stock Market Analysis on 27th December and 23rd December Post Market Review

U.S. markets are closed on Monday in observance of Christmas Day, which falls on Sunday. U.S. indices were up on Friday, while the inflation data released on Friday is being accessed as the market diverges in outlook vs the Fed. The Dow Jones was up 0.53% to 33,203.93, the S&P500 rose 0.59% to 3,844.82, and the NASDAQ was up 0.21% to 10,497.86. At the same time, oil prices jumped.

Notable News

  • China to scrap Covid quarantine rule for inbound travelers from Jan 8
  • US Core PCE Price Index +0.2% M/M, matching estimates; Consumer spending stagnated at +0.1% M/M - weakest since Jul-22 and below 0.2% forecast
  • Uni of Michigan Consumer Sentiment Index rose to 59.7, up from Oct's 56.8, helped by easing inflation pressures
  • US new home sales unexpected rose for second month
  • BOJ's Kuroda dismisses near-term chance of exiting easy policy

What To Watch This Week

  • Japan - Unemployment, Retail Sales (Tuesday), Industrial Production (Wednesday)
  • China - Industrial Profits (Tuesday), Manufacturing PMI (Saturday)
  • US - Goods Trade Balance, Retail Inventories (27th), Pending Home Sales (Wednesday), Initial Jobless Claims (Thursday)
  • UK - Nationwide Housing Pries (Friday)
  • At home, PPI (Thursday), Money Supply (Friday) are due

Long-term view on market and 2023 outlook:

In general, investors are still concerned about the market outlook and the fears are increasing. The economic recession seems inevitable, as major monetary authorities are determined to continue to battle high inflation. In my view, monetary policy will turn accommodative as inflation trends down. Growth pressures still weigh on developed markets' equity in 1Q 2023, but a turn in monetary policy will provide liquidity support to asset prices. Consensus expects interest rates to peak around 5.0% in the middle of 2023, which indicates it is closer to the end of the hiking cycle. I remain cautious on U.S. equities into 1Q 2023, and I believe the market will be more positive as markets bottom out in 2Q 2023.

27th December trading analysis

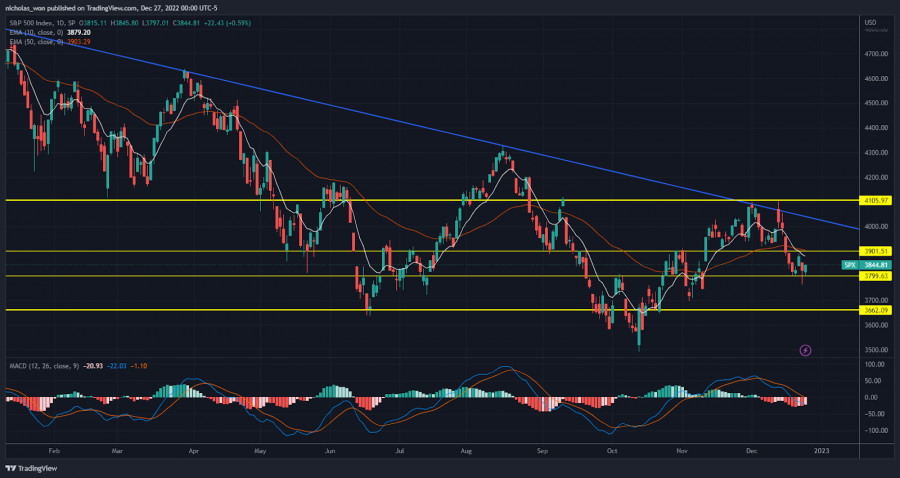
S&P 500 daily chart:

This image is no longer relevant

The S&P 500 index finished higher in a turbulent pre-holiday session Friday, as an inflation report and a slew of other data did nothing to change views that the Federal Reserve would likely keep raising interest rates even if the economy slowed. From the daily chart, the price is hovering between $3,784 support level and $3,947 resistance level. It is crucial to continue to watch the price movement in these few days to see whether the bull traders will successfully break through the $3,947 resistance level and push it to the next support level at around $4,072, or the bear traders will pull the price to the $3,784 support line and continue fall to the $3,662 support line. Traders may find an opportunity to trade between $3,784 and $3,947 as the index already traded in this range for a few days. Nonetheless, given the Fed would likely continue to raise the interest rate and the index is still trading below its 10MA and 50MA lines, I suggest traders remain cautious.

Pilih carta masa
5
min
15
min
30
min
1
jam
4
jam
1
hari
1
minggu
Jana pendapatan melalui perubahan kadar mata wang kripto dengan InstaForex.
Muat turun MetaTrader 4 dan buka dagangan pertama anda.
  • Grand Choice
    Contest by
    InstaForex
    InstaForex always strives to help you
    fulfill your biggest dreams.
    SERTAI PERADUAN

Artikel yang dicadangkan

Analisis Teknikal Pergerakan Harga Harian Indeks Nasdaq 100, Jumaat 02 Mei 2025.

Daripada apa yang dilihat pada carta 4-jam indeks Nasdaq 100, penunjuk Pengayun Stochastic berada dalam keadaan 'Crossing SELL' dan terdapat kemunculan corak 'Rising Wedge' jadi berdasarkan dua keadaan ini dalam

Arief Makmur 08:04 2025-05-02 UTC+2

Isyarat Dagangan untuk EMAS (XAU/USD) bagi 1-3 Mei 2025: beli di atas $3,203 (200 EMA - 5/8 Murray)

Harga logam kuning dijangka bergerak antara 3,203 dan boleh mencapai bahagian bawah saluran menurun sekitar 3,181 dalam beberapa hari akan datang, satu tahap yang bertepatan dengan 200 EMA pada 3,173

Dimitrios Zappas 17:49 2025-05-01 UTC+2

Isyarat Dagangan untuk EUR/USD bagi 30 April 2025: jual di bawah 1.1376 (21 SMA - 7/8 Murray)

pada awal sesi Amerika, pasangan EUR/USD didagangkan sekitar 1.1378 dalam saluran aliran menurun yang terbentuk pada 17 April dan menunjukkan tanda-tanda keletihan kekuatan menaik. Pembetulan teknikal berkemungkinan berlaku dalam beberapa

Dimitrios Zappas 17:37 2025-04-30 UTC+2

Analisis Teknikal Pergerakan Harga Harian Pasangan Mata Wang Silang AUD/JPY, Rabu, 30 April 2025.

Dengan kemunculan pola Divergent dan Descending Broadening Wedge pada carta 4 jam bagi pasangan mata wang silang AUD/JPY, walaupun pergerakan harganya berada di bawah EMA (21) yang mempunyai cerun menurun

Arief Makmur 06:19 2025-04-30 UTC+2

Analisis Teknikal Pergerakan Harga Intraday Pasangan Mata Wang Utama USD/JPY, Rabu 30 April 2025.

Pada carta 4 jam pasangan mata wang utama USD/JPY, dapat dilihat bahawa penunjuk Pengayun Stochastic membentuk corak Gandaan Bawah (Double Bottom) manakala pergerakan harga USD/JPY membentuk corak Higher High, justeru

Arief Makmur 06:17 2025-04-30 UTC+2

Isyarat Dagangan EMAS (XAU/USD) untuk 29-30 April 2025: beli di atas $3,310 (21 SMA - 7/8 Murray)

Pada awal sesi dagangan Amerika, emas didagangkan sekitar paras 3,310, yang bertepatan dengan purata bergerak ringkas 21 tempoh dan terletak dalam corak segi tiga simetri yang terbentuk sejak 23 April

Dimitrios Zappas 18:10 2025-04-29 UTC+2

Isyarat Dagangan untuk EUR/USD bagi 29-30 April, 2025: jual di bawah 1.1410 (segitiga simetri - 7/8 Murray)

Rancangan dagangan kami untuk beberapa jam akan datang adalah untuk menjual di bawah 1.1410 dengan sasaran pada 1.1370 dan 1.1230. Penunjuk eagle sedang memberikan isyarat negatif, jadi kami percaya pembetulan

Dimitrios Zappas 17:52 2025-04-29 UTC+2

Isyarat Dagangan untuk EUR/USD bagi 28-30 April 2025: jual di bawah 1.1370 (21 SMA - 7/8 Murray)

Sebaliknya, jika tekanan penurunan berterusan dan euro mengukuh di bawah 1.1370, ia boleh dianggap sebagai isyarat jual dengan sasaran pada 6/8 Murray terletak pada 1.1230 dan akhirnya di bahagian bawah

Dimitrios Zappas 16:29 2025-04-28 UTC+2

Isyarat Dagangan EMAS (XAU/USD) untuk 28-30 April 2025: beli melebihi $3,270 (21 SMA - 7/8 Murray)

Pada awal sesi dagangan Amerika, emas didagangkan sekitar paras 3,299 dalam saluran aliran menurun yang terbentuk sejak 21 April, menunjukkan pemulihan di atas sokongan pada paras 3,270. Pada carta

Dimitrios Zappas 16:25 2025-04-28 UTC+2

GOLD – Tinjauan Analisis Teknikal

Minggu lepas, 'kenaikan harga' telah mengemaskini rekod tertinggi dan membentuk maksimum ekstrem yang baru pada 3499.58. Selepas itu, emas memasuki pembetulan ke bawah menuju sokongan aliran jangka pendek harian pada

Evangelos Poulakis 06:49 2025-04-28 UTC+2
Tidak boleh bertanya sekarang?
Tanya soalan anda di Ruangan bersembang.
Panggilan semula Widget
 

Dear visitor,

Your IP address shows that you are currently located in the USA. If you are a resident of the United States, you are prohibited from using the services of InstaFintech Group including online trading, online transfers, deposit/withdrawal of funds, etc.

If you think you are seeing this message by mistake and your location is not the US, kindly proceed to the website. Otherwise, you must leave the website in order to comply with government restrictions.

Why does your IP address show your location as the USA?

  • - you are using a VPN provided by a hosting company based in the United States;
  • - your IP does not have proper WHOIS records;
  • - an error occurred in the WHOIS geolocation database.

Please confirm whether you are a US resident or not by clicking the relevant button below. If you choose the wrong option, being a US resident, you will not be able to open an account with InstaForex anyway.

We are sorry for any inconvenience caused by this message.