empty
15.08.2022 09:23 AM
Technical analysis of EUR/USD for August 15-20, 2022

Trend analysis

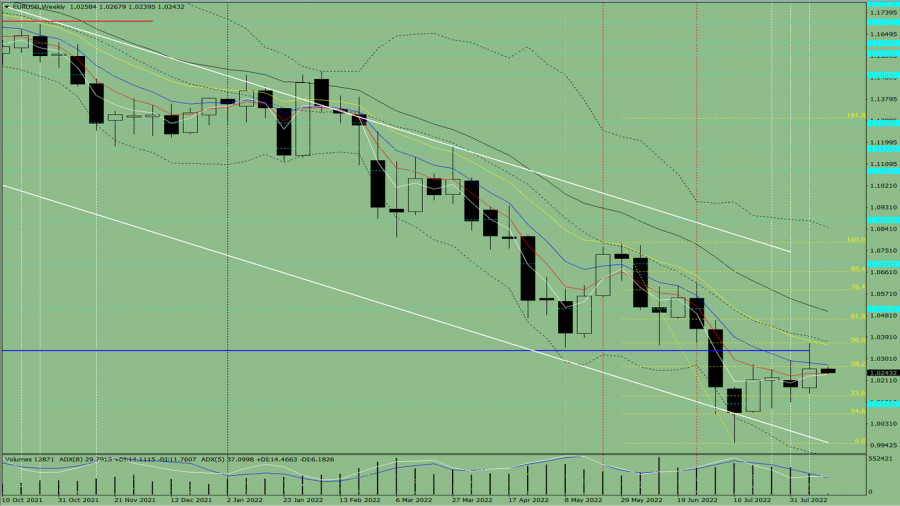
EUR/USD will increase this week, starting from 1.0259 (closing of the last weekly candle) to 1.0368, which is the 50.0% retracement level (yellow dotted line). Then, it will continue moving up to the 61.8% retracement level at 1.0466 (yellow dotted line), before returning to 1.0273, which is the 13 EMA (yellow thin line). Quotes are likely to resume rising after these movements.

This image is no longer relevant

Fig. 1 (weekly chart)

Comprehensive analysis:

Indicator analysis - uptrend

Fibonacci levels - uptrend

Volumes - uptrend

Candlestick analysis - uptrend

Trend analysis - uptrend

Bollinger bands - uptrend

Monthly chart - uptrend

All this points to an upward movement in EUR/USD.

Conclusion: The pair will have an upward trend, with no first lower shadow on the weekly white candle (Monday - up) and no second upper shadow (Friday - up).

During the week, euro will climb from 1.0259 (closing of the last weekly candle) to the 50.0% retracement level at 1.0368 (yellow dotted line), go to the 61.8% retracement level at 1.0466 (yellow dotted line), and bounce back to the 13 EMA at 1.0273 (yellow thin line). Quotes are likely to resume rising after these movements.

Alternatively, the pair could dip from 1.0259 (closing of the last weekly candle) to the historical support level of 1.0114 (dashed blue line), then go up to the resistance line at 1.0335 (thick blue line).

Stefan Doll,
Analytical expert of InstaForex
© 2007-2025
Select timeframe
5
min
15
min
30
min
1
hour
4
hours
1
day
1
week
Earn on cryptocurrency rate changes with InstaForex
Download MetaTrader 4 and open your first trade
  • Grand Choice
    Contest by
    InstaForex
    InstaForex always strives to help you
    fulfill your biggest dreams.
    JOIN CONTEST

Recommended Stories

Technical Analysis of Intraday Price Movement Nasdaq 100 Index, Friday May 02, 2025.

From what is seen on the 4-hour chart of the Nasdaq 100 index, the Stochastic Oscillator indicator is in a Crossing SELL condition and the appearance of a Rising Wedge

Arief Makmur 08:04 2025-05-02 UTC+2

Trading Signals for GOLD (XAU/USD) for May 1-3, 2025: buy above $3,203 (200 EMA - 5/8 Murray)

The price of the yellow metal is likely to trade between 3,203 and could reach the bottom of the bearish channel around 3,181 in the coming days, a level that

Dimitrios Zappas 17:49 2025-05-01 UTC+2

Trading Signals for EUR/USD for April 30, 2025: sell below 1.1376 (21 SMA - 7/8 Murray)

Early in the American session, the EUR/USD pair is trading around 1.1378 within the downtrend channel formed on April 17 and showing signs of exhaustion of bullish strength. A technical

Dimitrios Zappas 17:37 2025-04-30 UTC+2

Forex forecast 30/04/2025: EUR/USD, AUD/USD, USD/JPY, Gold, and Bitcoin

Useful links: My other articles are available in this section InstaForex course for beginners Popular Analytics Open trading account Important: The begginers in forex trading need to be very careful

Sebastian Seliga 16:31 2025-04-30 UTC+2

Trading Signals for GOLD (XAU/USD) for April 30, 2025: buy above $3,270 (21 SMA - 6/8 Murray)

Early in the American session, gold is trading around 3,384, above key support and rebounding after reaching 3,267. Gold is expected to regain strength if it consolidates above 3,381 (6/8

Dimitrios Zappas 15:07 2025-04-30 UTC+2

Forex forecast 29/04/2025: EUR/USD, GBP/USD, Gold, Ethereum and Bitcoin

Useful links: My other articles are available in this section InstaForex course for beginners Popular Analytics Open trading account Important: The begginers in forex trading need to be very careful

Sebastian Seliga 08:41 2025-04-30 UTC+2

Technical Analysis of Intraday Price Movement of AUD/JPY Cross Currency Pairs, Wednesday April 30, 2025.

With the appearance of Divergent and Descending Broadening Wedge patterns on the 4-hour chart of the AUD/JPY cross currency pair, although its price movement is below the EMA (21) which

Arief Makmur 06:19 2025-04-30 UTC+2

Technical Analysis of Intraday Price Movement of USD/JPY Main Currency Pairs, Wednesday April 30, 2025.

On the 4-hour chart of the main currency pair USD/JPY, it can be seen that the Stochastic Oscillator indicator forms a Double Bottom pattern while the price movement of USD/JPY

Arief Makmur 06:17 2025-04-30 UTC+2

Trading Signals for GOLD (XAU/USD) for April 29-30, 2025: buy above $3,310 (21 SMA - 7/8 Murray)

Early in the American session, gold is trading around the 3,310 level, where it is located at the 21SMA and within a symmetrical triangle pattern formed on April 23. Consolidation

Dimitrios Zappas 18:10 2025-04-29 UTC+2

Trading Signals for EUR/USD for April 29-30, 2025: sell below 1.1410 (symmetrical triangle - 7/8 Murray)

Our trading plan for the coming hours is to sell below 1.1410 with targets at 1.1370 and 1.1230. The eagle indicator is giving a negative signal, so we believe

Dimitrios Zappas 17:52 2025-04-29 UTC+2
Can't speak right now?
Ask your question in the chat.
Widget callback
 

Dear visitor,

Your IP address shows that you are currently located in the USA. If you are a resident of the United States, you are prohibited from using the services of InstaFintech Group including online trading, online transfers, deposit/withdrawal of funds, etc.

If you think you are seeing this message by mistake and your location is not the US, kindly proceed to the website. Otherwise, you must leave the website in order to comply with government restrictions.

Why does your IP address show your location as the USA?

  • - you are using a VPN provided by a hosting company based in the United States;
  • - your IP does not have proper WHOIS records;
  • - an error occurred in the WHOIS geolocation database.

Please confirm whether you are a US resident or not by clicking the relevant button below. If you choose the wrong option, being a US resident, you will not be able to open an account with InstaForex anyway.

We are sorry for any inconvenience caused by this message.