empty
 
 
20.02.2025 11:42 AM
GBP/USD – February 20th: UK Inflation Fails to Support Bulls

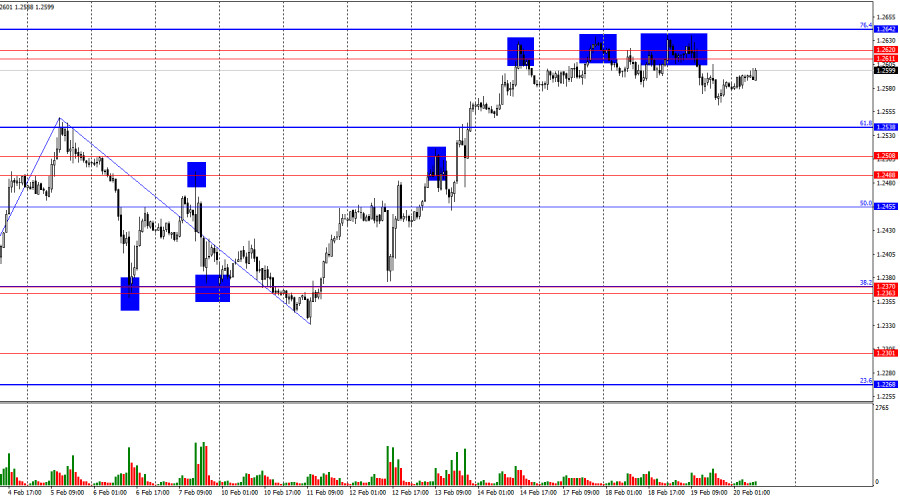
On the hourly chart, GBP/USD rebounded for the third consecutive time from the 1.2611–1.2620 resistance zone, experiencing a slight decline toward the 61.8% Fibonacci retracement level at 1.2538. Today, the downward movement may continue, with another rebound from the 1.2611–1.2620 zone providing a fresh opportunity to sell the pair. A confirmed breakout above the 76.4% Fibonacci level at 1.2642 would increase the likelihood of further growth toward 1.2709.

This image is no longer relevant

The wave structure is quite clear. The most recent completed downward wave did not break the previous low, while the most recent upward wave surpassed the previous peak. This suggests that a bullish trend is still in place. However, the waves have varied significantly in size, creating multiple structural possibilities. There is no certainty that the current trend will continue for several more weeks, but at the same time, it is difficult to ignore the strong performance of the British pound in recent weeks.

On Wednesday, the fundamental backdrop was once again strong for the pound, yet traders showed little reaction. The UK core inflation rate surged to 3.7% y/y, while the headline inflation rate rose to 3%, exceeding expectations. Under normal circumstances, these numbers would support buying pressure on the pound. However, the bulls failed to break above the 1.2611–1.2620 resistance zone and did not even attempt to do so.

The inflation report was significant, with unexpected readings, yet the market largely ignored it, much like it ignored the FOMC meeting minutes, which signaled that the Federal Reserve remains less dovish than expected for the rest of the year. GBP/USD has stalled around 1.2600, seemingly uncertain about its next direction. While there are reasons to expect further growth, there are also factors supporting a potential decline. At this point, the key level to watch is 1.2611–1.2620.

This image is no longer relevant

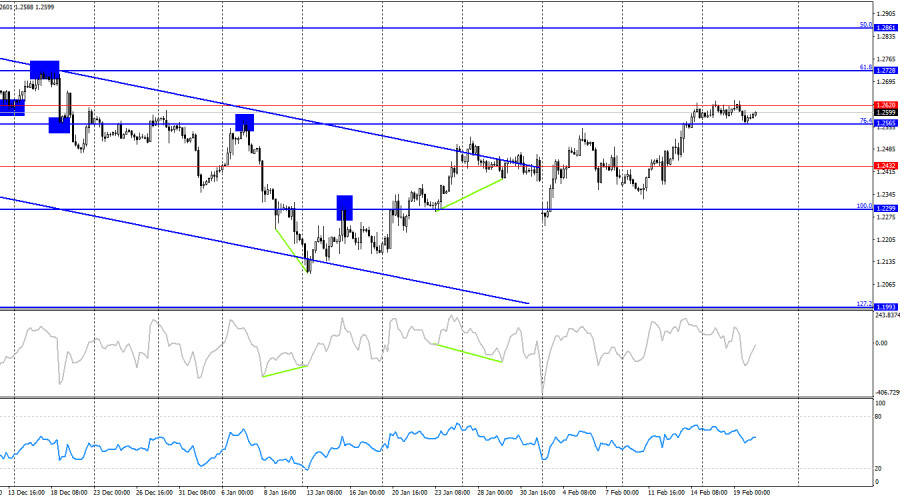
On the 4-hour chart, GBP/USD remains in an upward trajectory, currently positioned within the 1.2565–1.2620 resistance zone. If bulls continue to push the pair higher without fundamental support, the pound could extend its gains further. However, the current market conditions do not strongly support further upside. Given this, technical analysis may play a more significant role in determining trading decisions at this point.

Commitments of Traders (COT) Report

This image is no longer relevant

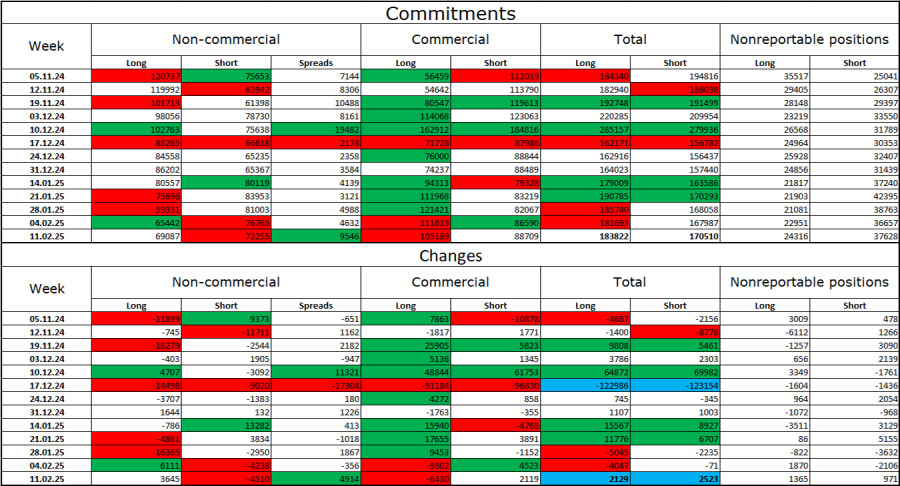
The Non-commercial category of traders became less bearish in the latest COT report. Long positions increased by 3,645 contracts, while short positions declined by 4,510 contracts. Although bulls have lost their market advantage, bears have not strengthened significantly either. The gap between long and short contracts remains in favor of bears at 69,000 vs. 72,000.

In my view, GBP remains at risk of further declines, as the COT data suggests a slow but steady increase in bearish sentiment. Over the last three months, long positions have dropped from 120,000 to 69,000, while short positions decreased only slightly from 75,000 to 72,000. Professional traders are likely to continue unwinding long positions or increasing short exposure, as most positive factors supporting the pound have already been priced in. While technical analysis currently suggests an uptrend, corrections are expected.

Key Economic Events for the U.S. and the U.K.:

  • U.S. – Initial Jobless Claims (13:30 UTC)
  • U.S. – Philadelphia Fed Manufacturing Index (13:30 UTC)

Thursday's economic calendar includes two reports, which are unlikely to significantly impact the market sentiment since traders already ignored more important data earlier in the week. The overall influence of fundamentals for the rest of the day is expected to be weak.

GBP/USD Forecast & Trading Recommendations

Selling opportunities may arise if the pair rebounds from the 1.2611–1.2642 zone on the hourly chart, targeting 1.2538 and 1.2508.

Buying opportunities were previously available above 1.2363–1.2370, with a target of 1.2488–1.2508, which has already been reached.

At the moment, I would not consider new long positions.

The Fibonacci retracement levels are drawn from 1.2809 to 1.2100 on the hourly chart and from 1.2299 to 1.3432 on the 4-hour chart.

Samir Klishi,
Analytical expert of InstaForex
© 2007-2025
Earn on cryptocurrency rate changes with InstaForex
Download MetaTrader 4 and open your first trade
  • Grand Choice
    Contest by
    InstaForex
    InstaForex always strives to help you
    fulfill your biggest dreams.
    JOIN CONTEST
  • Chancy Deposit
    Deposit your account with $3,000 and get $1000 more!
    In February we raffle $1000 within the Chancy Deposit campaign!
    Get a chance to win by depositing $3,000 to a trading account. Having fulfilled this condition, you become a campaign participant.
    JOIN CONTEST
  • Trade Wise, Win Device
    Top up your account with at least $500, sign up for the contest, and get a chance to win mobile devices.
    JOIN CONTEST
  • 100% Bonus
    Your unique opportunity to get a 100% bonus on your deposit
    GET BONUS
  • 55% Bonus
    Apply for a 55% bonus on your every deposit
    GET BONUS
  • 30% Bonus
    Receive a 30% bonus every time you top up your account
    GET BONUS

Recommended Stories

Can't speak right now?
Ask your question in the chat.
Widget callback