The GBP/USD currency pair had every reason to continue rising on Wednesday, just like it did the day before. However, this situation illustrates the paradox of a corrective movement: when there are strong fundamental reasons for growth, the pair often does not rise; conversely, when there are no apparent reasons for movement, the market tends to go higher. This highlights the chaotic nature of corrections, which are periods of market reassessment, profit-taking on previous positions, and the formation of new ones. Some reports logically influence price movements, while others do not.
On Tuesday, at least two out of three reports from the UK suggested ongoing support for further pound buying, as there were no other significant reports. Traders should have continued their actions from the previous week. However, despite reports showing a 6% increase in wages and steady unemployment, the British currency did not strengthen. The same trend continued on Wednesday, when UK inflation surged to 3%, rising by 0.5% in just one month. Clearly, the Bank of England is now likely to reconsider lowering interest rates anytime soon. This represents a hawkish and bullish factor, yet the pound still did not rise.
Several scenarios are possible moving forward. Since the upward correction on the daily timeframe is ongoing, chaotic movements on lower TFs may persist. The market may also ignore the high inflation and wage reports because they are no longer relevant to the BoE's decision-making process. In other words, the BoE is now likely more concerned about economic growth than inflation. This suggests it will continue its monetary easing cycle in any case.
This remains an assumption, as no one knows what inflation threshold the BoE considers critical. In other words, it is unclear at what inflation level the BoE would consider pausing or reversing its monetary easing. Therefore, predicting the GBP/USD pair's next move from its current position is extremely difficult. Since the price remains above the moving average, an upward move seems likely, but with a pause. However, on the daily TF, the price has already tested the upper boundary of the Ichimoku Cloud, meaning that a resumption of the downtrend is also possible.
We advise traders to keep in mind that the pound, similar to the euro, is currently experiencing two downtrends: a 4-month trend and a 16-year trend. Therefore, medium-term purchases are not advisable until there are significant changes in the global economic environment. Given the Federal Reserve's potential decision not to cut rates in 2025, we believe that the dollar has a much greater likelihood of experiencing a new rise. This outcome may not be favorable for Donald Trump personally.
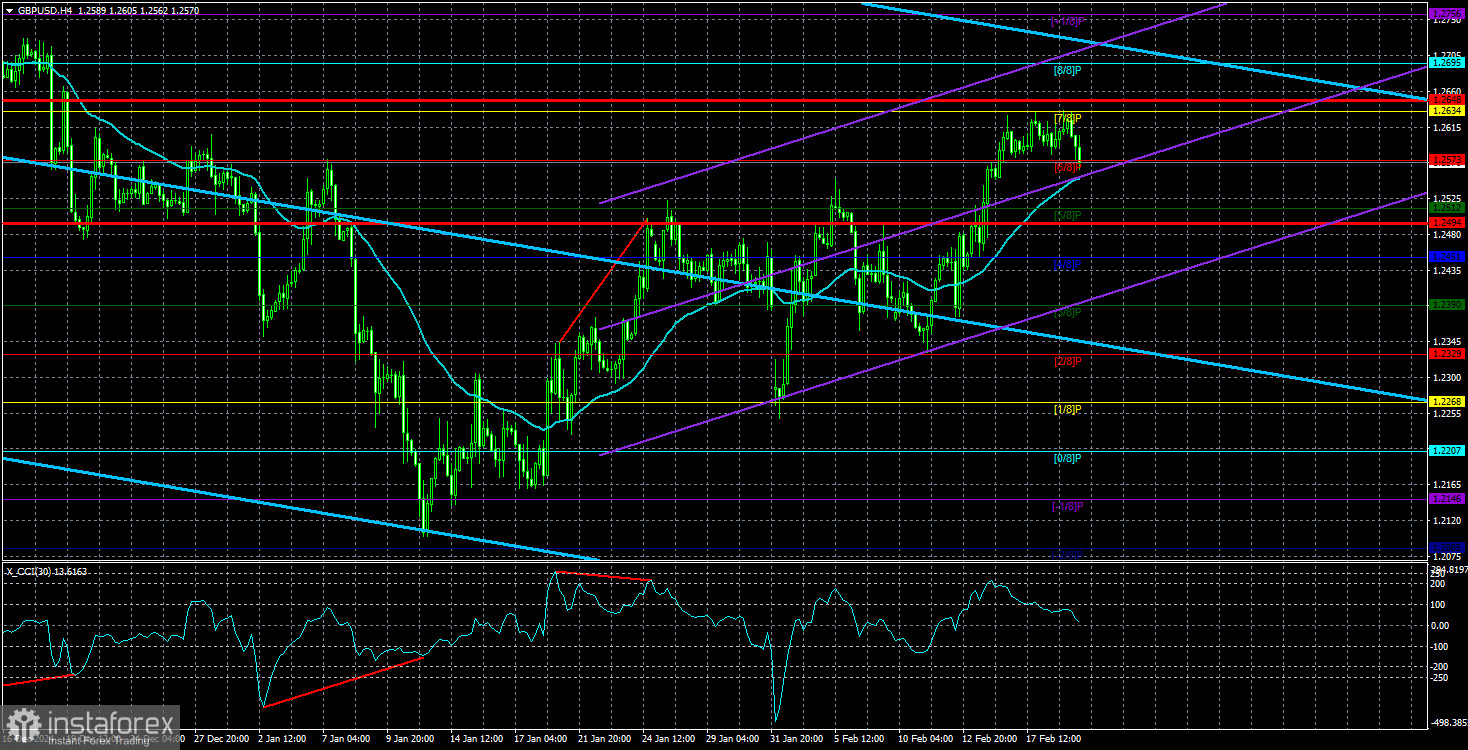
The average volatility of GBP/USD over the past five trading days as of February 20 stands at 77 pips, which is considered "average." We expect the pair to trade within the range of 1.2494 – 1.2648 on Thursday. The long-term regression channel remains downward, indicating that the global bearish trend remains intact. The CCI indicator recently entered the oversold zone, signaling a new bullish correction attempt.
Nearest Support Levels:
S1 – 1.2573
S2 – 1.2512
S3 – 1.2451
Nearest Resistance Levels:
R1 – 1.2634
R2 – 1.2695
R3 – 1.2756
Trading Recommendations:
The GBP/USD pair maintains a medium-term downward trend. We continue to avoid long positions, as we believe that all potential bullish factors for the pound have already been priced in multiple times, and there are no new catalysts for further growth.
For traders using pure technical analysis, long positions above the moving average are possible, with targets at 1.2634 and 1.2648. However, short positions remain more attractive, with targets at 1.2207 and 1.2146, as the upward correction on the daily TF will eventually end. For short positions, traders should wait for a confirmed breakout below the moving average. Ideally, short entries should be initiated at the end of the current upward correction, but it is impossible to predict exactly when this correction will end.
Explanation of Illustrations:
Linear Regression Channels help determine the current trend. If both channels are aligned, it indicates a strong trend.
Moving Average Line (settings: 20,0, smoothed) defines the short-term trend and guides the trading direction.
Murray Levels act as target levels for movements and corrections.
Volatility Levels (red lines) represent the likely price range for the pair over the next 24 hours based on current volatility readings.
CCI Indicator: If it enters the oversold region (below -250) or overbought region (above +250), it signals an impending trend reversal in the opposite direction.