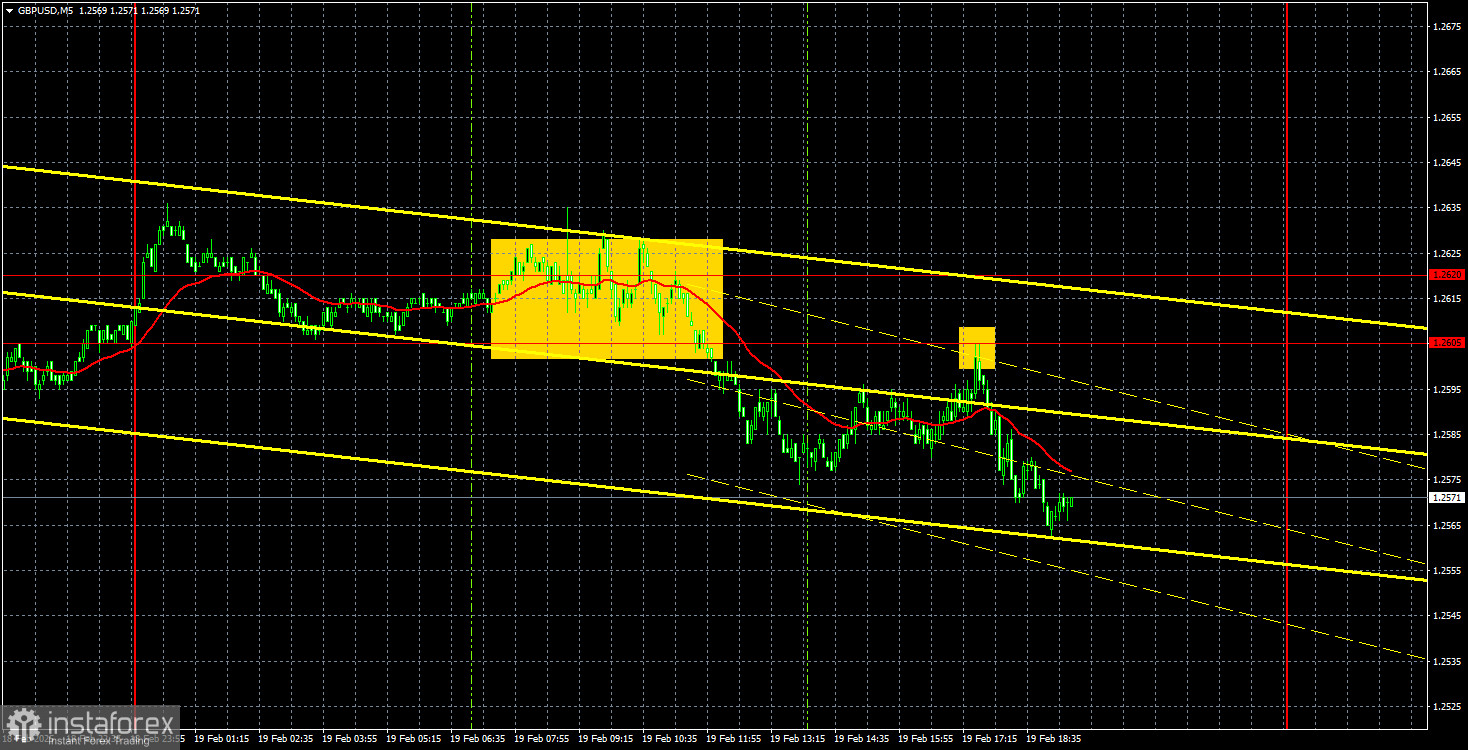
GBP/USD 5-Minute Analysis
The GBP/USD currency pair experienced a decline on Wednesday, which seemed illogical. In our previous analyses, we have noted similar irrational intraday movements occurring frequently. On Tuesday, two economic reports from the UK supported the notion of the pound continuing to rise, even though their figures weren't decisively strong. Then, on Wednesday, the inflation report was released, further bolstering signals for pound appreciation. However, instead of increasing, the pair fell. In contrast, last week saw the British currency rally for five consecutive days without solid justification. This entire pattern appears to be a correction that is still ongoing on the daily timeframe. The price may continue to decline for a while before rising again, all without clear fundamental or macroeconomic reasoning.
On the hourly timeframe, the uptrend remains intact, but there is no visible trendline, indicating that a new bearish trend could begin at any moment. Despite the strong inflation report, which decreases the likelihood of three additional rate cuts by the Bank of England this year, the pound still continues to drop. This suggests that the pair may keep falling today, particularly since the economic calendar is nearly empty.
On the 5-minute timeframe, two trading signals were established yesterday. Initially, the pair bounced off the 1.2605–1.2620 zone and later rebounded solely from 1.2605. In the first case, the pair moved downward by about 20 pips, allowing traders to place a stop-loss at breakeven. In the second instance, the movement was slightly larger. In the evening, traders could manually close short positions; however, today the decline may continue. Therefore, it's advisable to set the Stop Loss to zero.
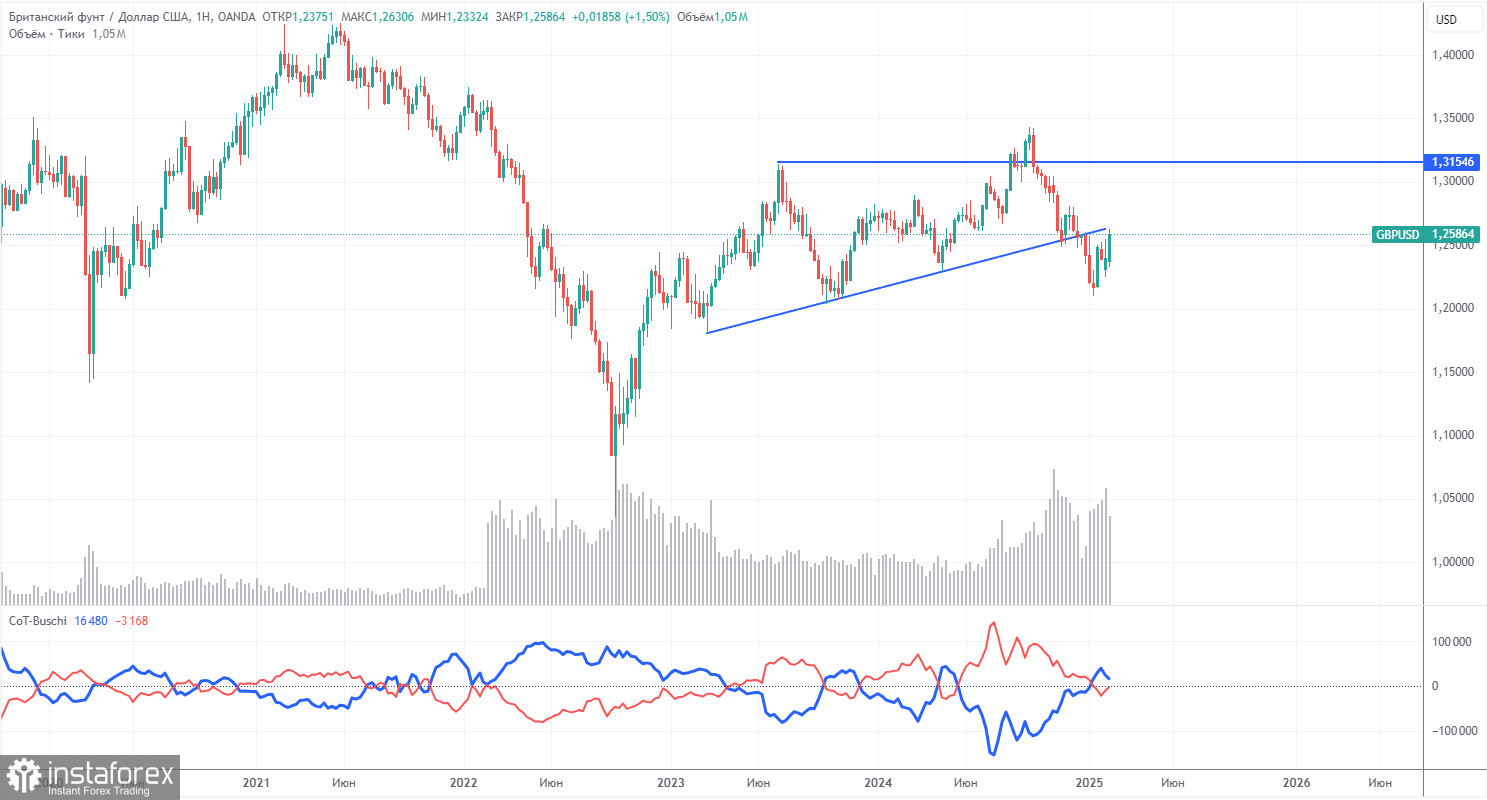
COT Report
The Commitments of Traders (COT) reports for the British pound indicate that sentiment among commercial traders has been consistently shifting over the past few years. The red and blue lines, which represent the net positions of commercial and non-commercial traders, frequently intersect and generally remain close to the zero level. Currently, these lines are near each other, suggesting that the number of buy and sell positions is almost equal.
On the weekly timeframe, the price initially broke through the 1.3154 level before dropping to the trendline, which it subsequently breached. This break of the trendline strongly suggests that the pound's decline is likely to continue. However, there was also a rebound from the previous local low on the weekly timeframe, indicating that the currency pair may be experiencing a flat.
According to the latest COT report, the Non-commercial group opened 3,600 buy contracts and closed 4,500 sell contracts, resulting in an increase of 8,100 in net positions. However, this shift does not provide any substantial support for the pound.
The fundamental backdrop still does not justify long-term purchases of the pound, and the currency has a real chance of continuing its global downtrend. As such, net positions may continue to decline, signaling a potential further drop in demand for the British pound.
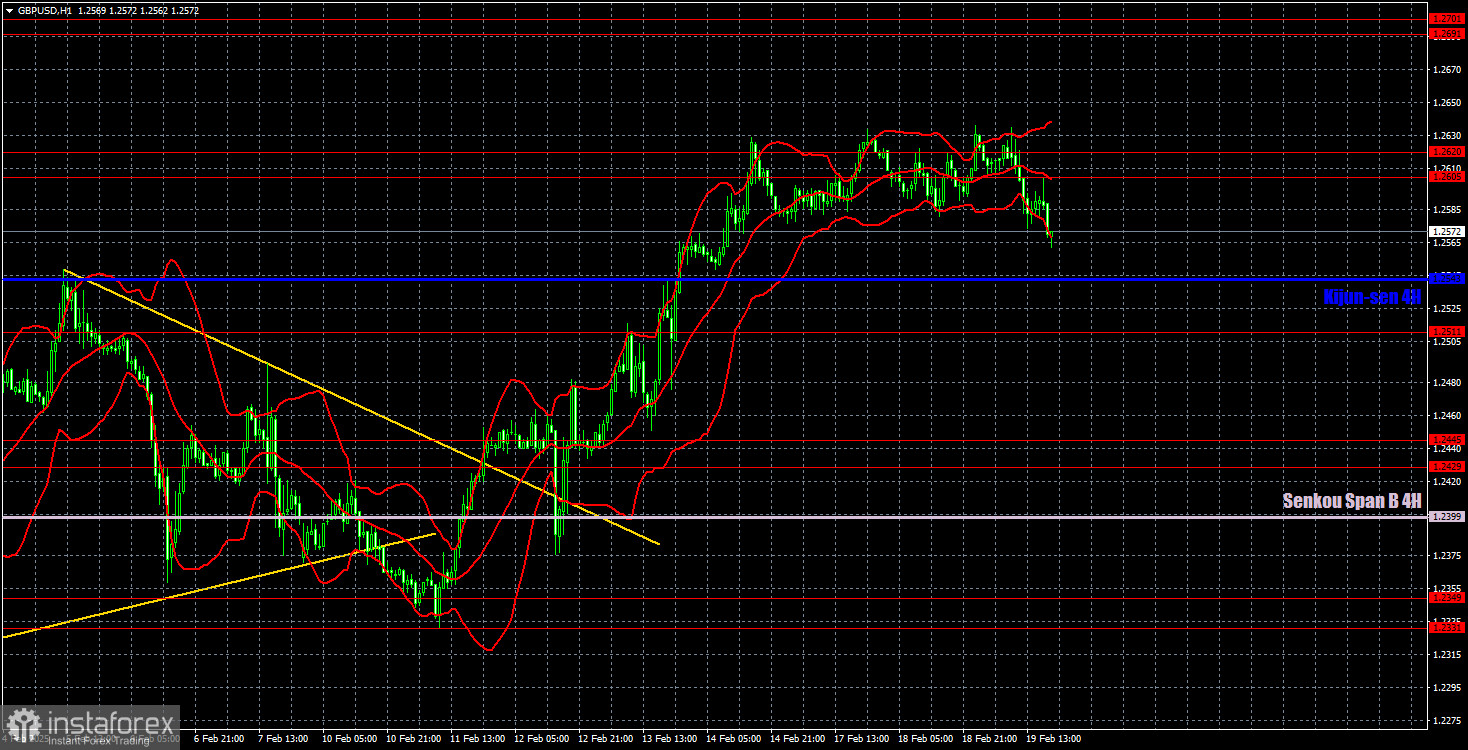
GBP/USD 1-Hour Analysis
On the hourly timeframe, GBP/USD continues to exhibit a consistent uptrend. However, this may not be the last in a series of changing trends. We still do not understand why the pound sterling should show growth in the long term. On higher timeframes, we do not recommend taking long positions, as the pound lacks fundamental stability. Currently, the only reason for its rise appears to be a correction on the daily timeframe.
For February 20, we highlight the following key levels: 1.2052, 1.2109, 1.2237-1.2255, 1.2331-1.2349, 1.2429-1.2445, 1.2511, 1.2605-1.2620, 1.2691-1.2701, and 1.2796-1.2816. Additionally, the Senkou Span B at 1.2399 and the Kijun-sen at 1.2543 may serve as potential trading signals. A Stop Loss should be set at breakeven once the price moves 20 pips in the desired direction to help protect against potential losses from false signals.
On Thursday, no significant events or economic reports are scheduled in either the UK or the US. The only release in the US is the weekly jobless claims report, which rarely impacts the market significantly. As a result, we do not expect volatility to be higher than it was during the first three days of the week.
Illustration Explanations:
- Support and Resistance Levels (thick red lines): Thick red lines indicate where movement may come to an end. Please note that these lines are not sources of trading signals.
- Kijun-sen and Senkou Span B Lines: Ichimoku indicator lines transferred from the 4-hour timeframe to the hourly timeframe. These are strong lines.
- Extreme Levels (thin red lines): Thin red lines where the price has previously bounced. These serve as sources of trading signals.
- Yellow Lines: Trendlines, trend channels, or any other technical patterns.
- Indicator 1 on COT Charts: Represents the net position size for each category of traders.