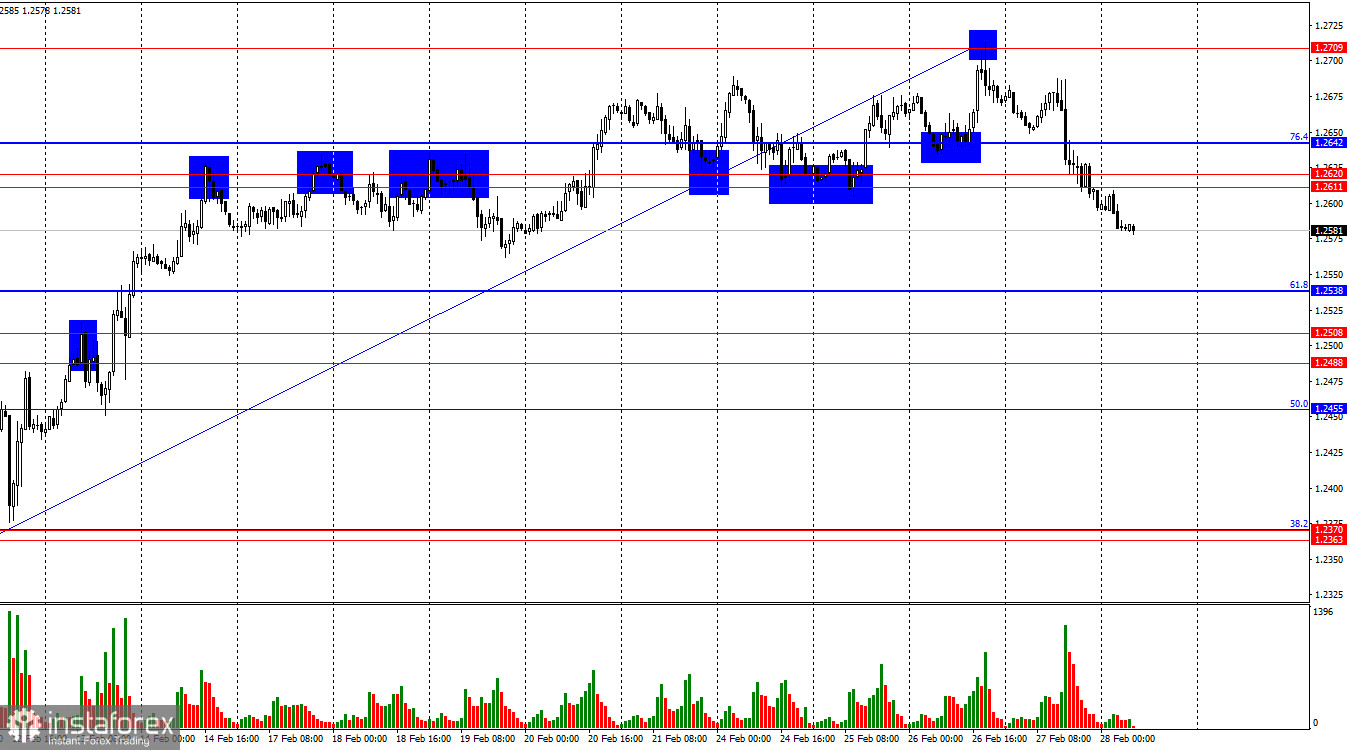
On the hourly chart, the GBP/USD pair continued its decline on Thursday, first consolidating below the 76.4% Fibonacci level at 1.2642 and then breaching the support zone at 1.2611–1.2620. This zone had provided support for bulls for over a week, and its breakdown signifies that bears have taken control. Consequently, I expect the pound's decline to continue towards the 61.8% Fibonacci retracement level at 1.2538. A rebound from this level could signal a reversal in favor of the pound, though a significant rally is unlikely.
The wave structure remains clear. The most recent completed downward wave did not break below the low of the previous wave, while the last upward wave surpassed the prior peak. This suggests that the bullish trend is still in play. However, graphical analysis indicates that at the very least, we are in for a downward wave. The pound had shown strong growth recently, but now the trend may shift to a bearish phase.
Thursday's fundamental backdrop was entirely in favor of bearish traders. Yesterday, the first key reports of the week were released in the U.S.. Although the market is constantly reacting to the flood of news from Donald Trump, economic reports still carry more weight. The final GDP figure for Q4 came in at 2.3%, marking a 0.8% slowdown from the third quarter. While this does not indicate an impending U.S. recession, as it represents just one quarter's performance, it does highlight that economic growth cannot be sustained indefinitely, especially under the Federal Reserve's restrictive monetary policy. Meanwhile, durable goods orders surged by 3.1% month-over-month, significantly exceeding market expectations. Additionally, December's data was revised upward from -2.2% to -1.8%, further bolstering sentiment. As a result, GBP/USD began to fall, bears took charge, and I expect further downside movement.
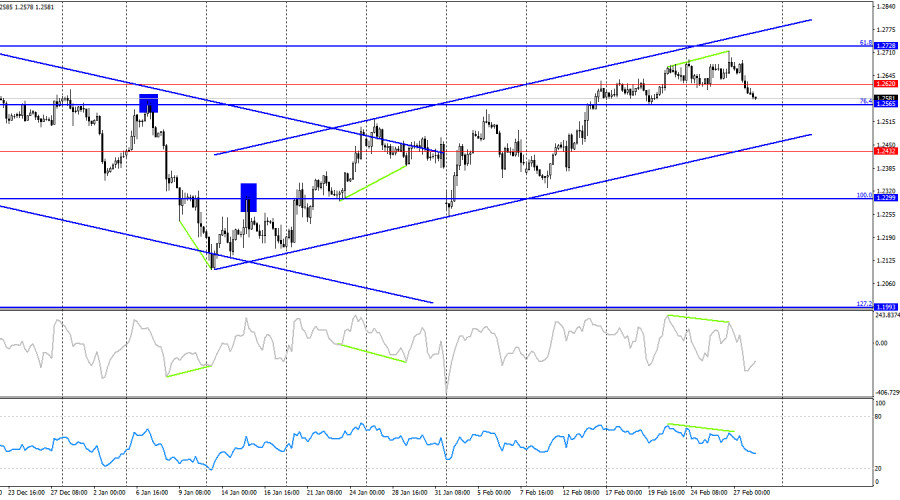
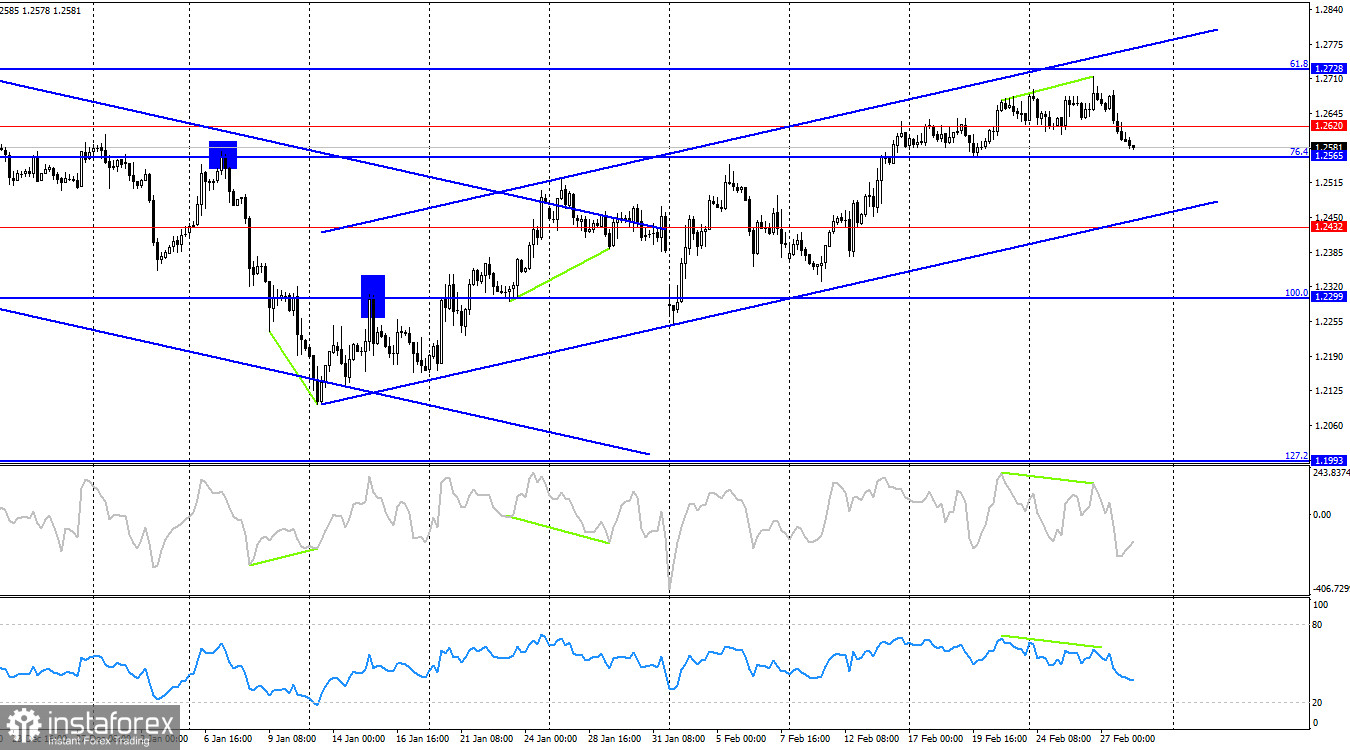
On the four-hour chart, the pair reversed in favor of the U.S. dollar following the formation of bearish divergence across both indicators. This suggests that the decline may continue towards the lower boundary of the upward trend channel. However, since this channel still indicates bullish sentiment, there is no reason to expect a prolonged or deep decline for the pound just yet. At present, no new divergences are forming on any indicators.
Commitments of Traders (COT) Report:
The sentiment among non-commercial traders became less bearish over the last reporting week. The number of long positions held by speculators increased by 4,477, while the number of short positions rose by 1,888. Although bulls have lost their dominance in the market, bears have yet to significantly increase their selling pressure. The current balance between long and short positions remains virtually even, at 73,000 vs. 74,000.
In my view, the pound remains poised for further declines, and the COT data indicates a slow but steady strengthening of bearish positions. Over the past three months, long positions have decreased from 120,000 to 73,000, while short positions have only slightly decreased from 75,000 to 74,000. I believe that over time, professional traders will continue to reduce their long positions or increase their shorts, as most of the supportive factors for the pound have already been exhausted. The currency has received temporary support from solid UK economic data, but graphical analysis currently points to further declines.
Key Economic Events for the U.S. and UK:
- U.S. Core Personal Consumption Expenditures (PCE) Price Index (13:30 UTC).
- U.S. Personal Income and Spending Data (13:30 UTC).
On Friday, the economic calendar includes two moderate-impact U.S. reports, meaning that the influence of fundamentals on trader sentiment in the second half of the day could be moderate.
GBP/USD Forecast and Trading Recommendations:
Short positions were viable after the pair consolidated below the 1.2611–1.2620 zone on the hourly chart, with a target of 1.2538. These trades can still be held open. At this stage, I would refrain from considering buy positions, as bulls have been attacking for an extended period and now need a break.
The Fibonacci retracement levels are drawn from 1.2809 to 1.2100 on the hourly chart and from 1.2299 to 1.3432 on the four-hour chart.