EUR/USD
Analysis:
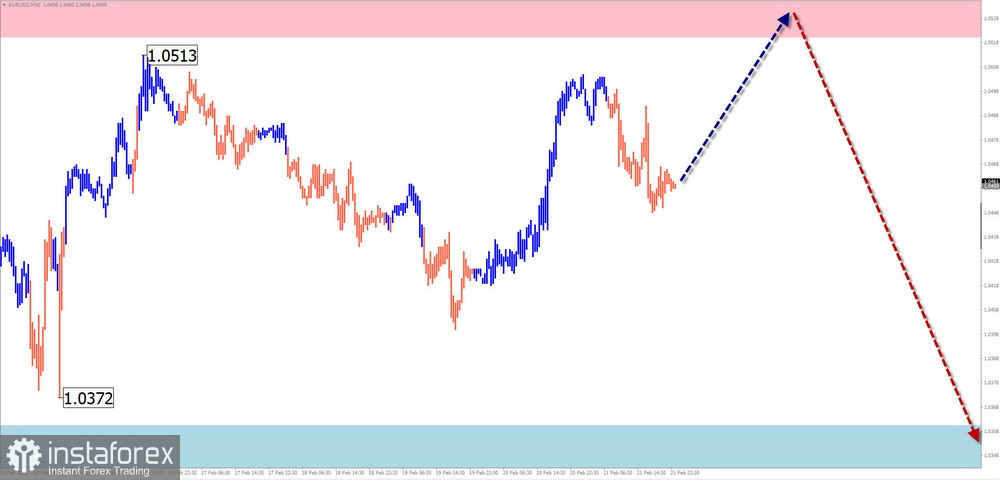
The incomplete short-term bullish wave on the euro's major chart has been forming since the beginning of the month, extending beyond the H4 timeframe. The final (C) wave is currently developing, with prices reaching the lower boundary of the potential reversal zone on the daily timeframe.
Forecast:
Over the next few days, the price is expected to gradually move toward the projected resistance level. Once this level is reached, a trend reversal and decline toward the support zone is likely. Increased volatility and a brief breakout above the reversal zone may occur before the price turns downward.
Potential Reversal Zones:
- Resistance: 1.0520 – 1.0570
- Support: 1.0360 – 1.0310
Trading Recommendations:
- Buying is considered risky due to the limited upward potential.
- Selling may become profitable once reversal signals appear near resistance.
USD/JPY
Analysis:
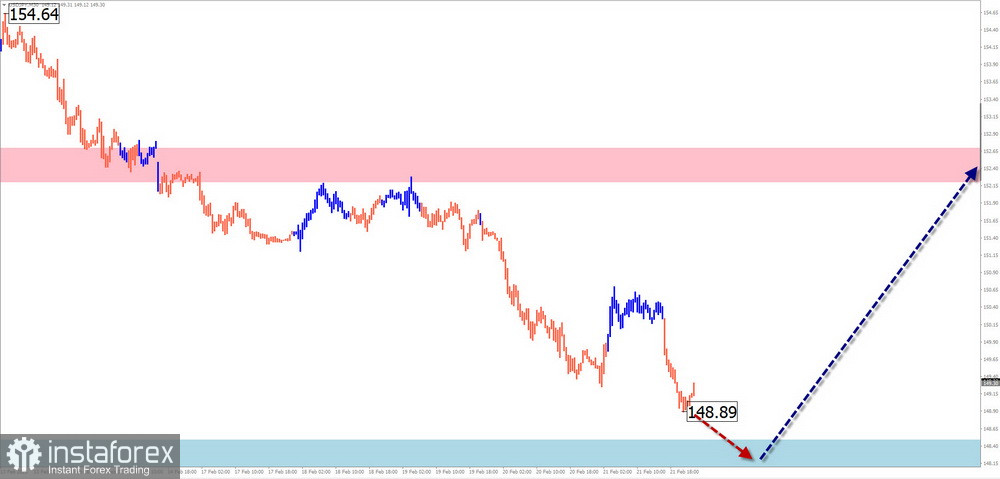
The key wave to watch in the Japanese yen market is the uptrend that began on August 5 last year. This wave is currently in a corrective phase, with prices approaching a major reversal zone on the daily chart. As of now, no clear reversal signals are visible.
Forecast:
At the start of the week, a reversal setup may form near the support zone. A temporary breakout below the support area is possible before the trend shifts upward again. The upper boundary of the expected price movement is indicated by the projected resistance level.
Potential Reversal Zones:
- Resistance: 152.20 – 152.70
- Support: 148.50 – 148.00
Trading Recommendations:
- Selling is not advisable as no strong signals are present.
- Buying may become attractive once reversal confirmations appear near support.
GBP/JPY
Analysis:
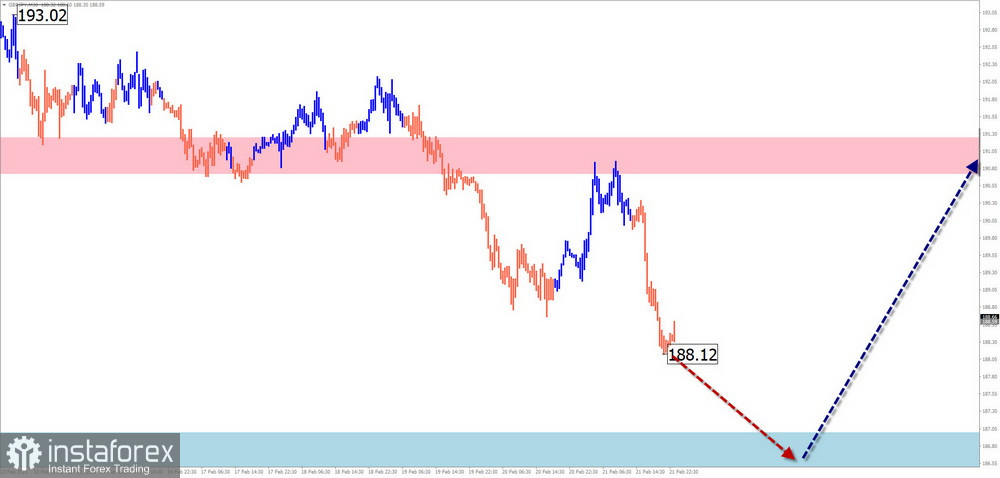
Since December, GBP/JPY has been following a downward wave pattern, with the current movement forming the final (C) wave after a correction phase. The price is now approaching the upper boundary of a key reversal zone.
Forecast:
At the beginning of the week, sideways movement with a downward bias is expected. The pair is likely to test the support zone, creating conditions for a trend reversal and potential price increase later in the week. A sharp increase in volatility is possible once the direction changes.
Potential Reversal Zones:
- Resistance: 190.70 – 194.20
- Support: 187.00 – 186.50
Trading Recommendations:
- Selling may lead to losses in the cross-market environment.
- Buying should be considered once confirmation signals appear near support.
USD/CAD
Analysis:
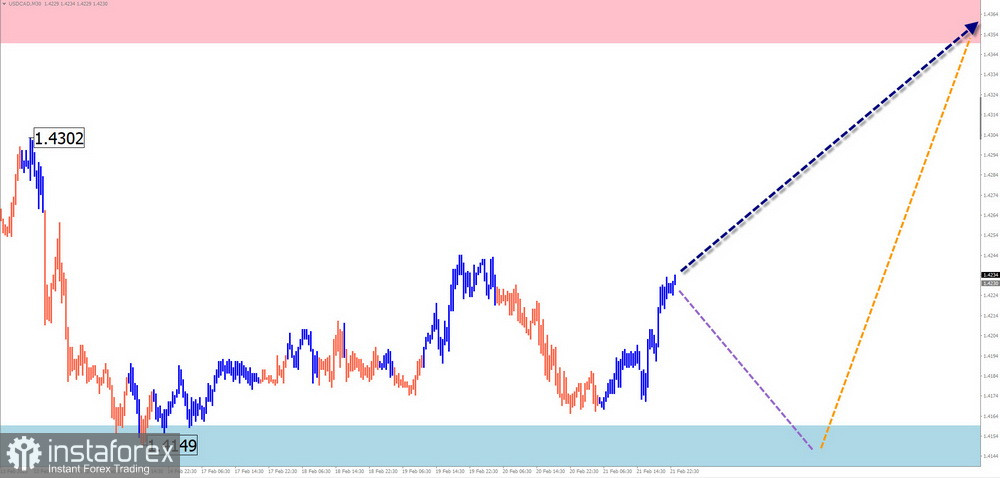
Since early February, USD/CAD has been developing a downward wave with strong momentum. Recently, the pair has been consolidating within a corrective phase that resembles a shifting flat pattern. The price is now near the lower boundary of the price corridor, but no immediate reversal signals are visible.
Forecast:
Sideways movement is expected during the first half of the week, with pressure on the support zone. By the end of the week, once reversal conditions emerge, a price increase toward the resistance levels is anticipated.
Potential Reversal Zones:
- Resistance: 1.4350 – 1.4400
- Support: 1.4160 – 1.4110
Trading Recommendations:
- Selling is considered high-risk due to limited downside potential.
- Buying is advisable with a reduced volume size, pending confirmation from your trading strategy.
NZD/USD
Analysis:
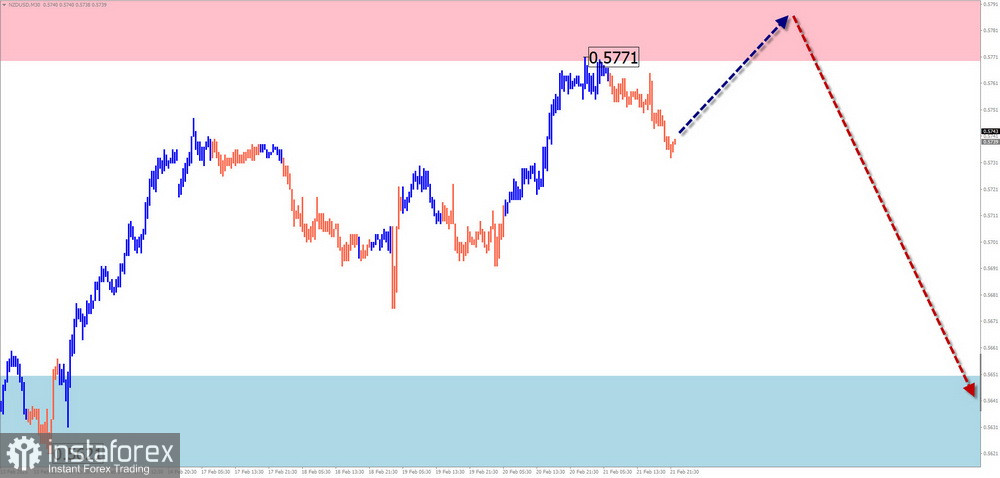
Since late last year, NZD/USD has been following a downward wave structure, forming a long corrective flat pattern since December. This movement is nearing its final phase, with prices now testing the potential reversal zone.
Forecast:
The pair is expected to continue moving higher until it completes its bullish correction near the projected resistance level. By the end of the week, a trend reversal may form, leading to a new downward movement.
Potential Reversal Zones:
- Resistance: 0.5770 – 0.5820
- Support: 0.5650 – 0.5600
Trading Recommendations:
- Buying is possible in smaller volume sizes during individual sessions, but gains are likely limited to the resistance area.
- Selling is premature until reversal signals emerge near resistance.
Bitcoin
Analysis:
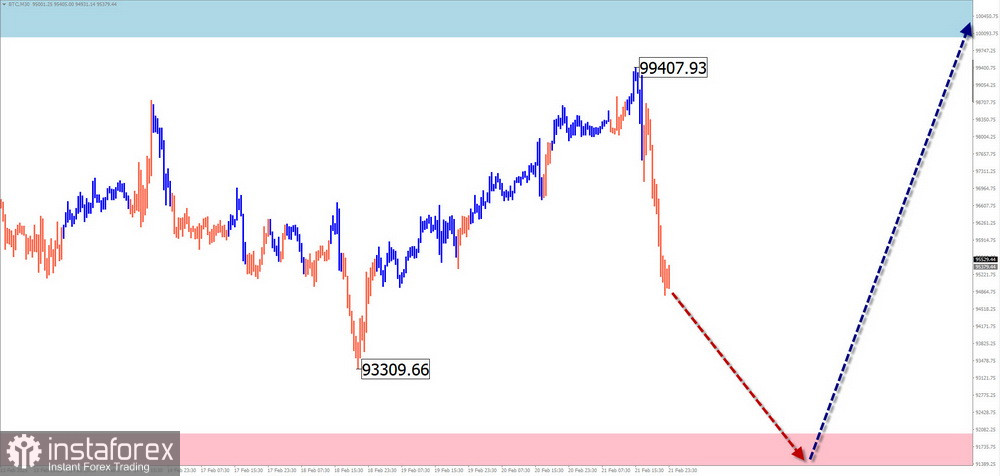
Bitcoin has been following a descending expanded flat pattern over the past couple of months. Since the start of February, a bullish wave with reversal potential has been forming. The middle (B) wave is nearing completion, with the price moving along the upper boundary of the weekly reversal zone.
Forecast:
At the start of the week, Bitcoin is likely to decline toward the support zone. Once a reversal formation develops, prices may resume their upward movement, eventually targeting resistance.
Potential Reversal Zones:
- Resistance: 100,000 – 101,000
- Support: 92,000 – 91,000
Trading Recommendations:
- Selling is possible with smaller volume sizes, but gains are limited.
- Buying becomes attractive once confirmed reversal signals appear near support.
Explanation of Simplified Wave Analysis (SWA):
- All waves consist of three parts (A-B-C).
- Each timeframe analyzes the most recent incomplete wave.
- Dashed lines indicate expected price movements.
Note: The wave algorithm does not account for time duration in market movements.