empty
06.02.2023 11:49 AM
EUR/USD and GBP/USD technical analysis on February 6, 2023

EUR/USD

This image is no longer relevant

Higher time frames

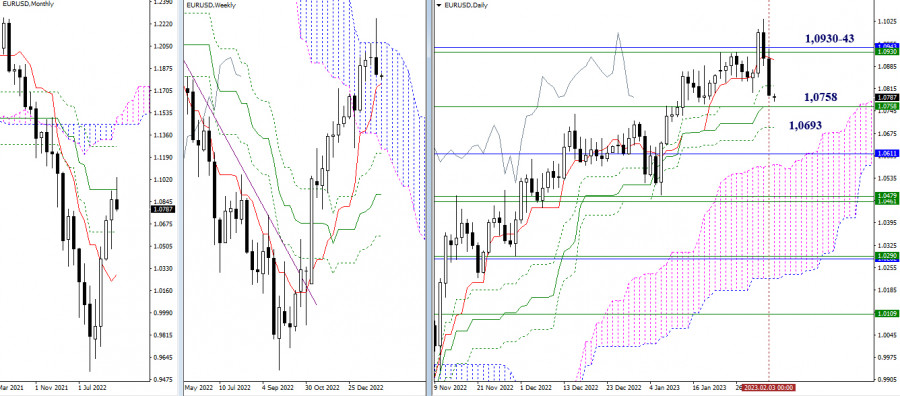
Last week, the pair bounced off the resistance area at 1.0930-43 which coincided with the upper boundary of the weekly Ichimoku Cloud and the monthly medium-term trend. To confirm a rebound and extend it further to the downside, bears need to overcome the support of the weekly short-term trend at 1.0758 and cancel the Golden Cross at 1.0758 – 1.0693.

This image is no longer relevant

H4 – H1

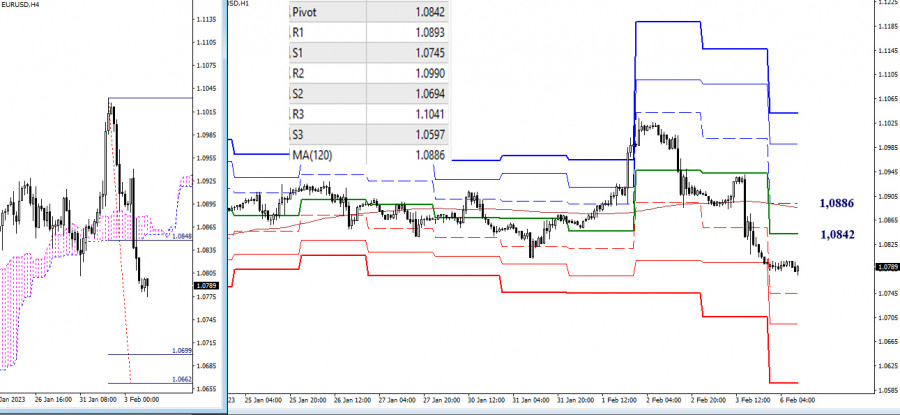
At the moment, bears have seized the initiative on lower time frames. Their downward targets for today are found at the standard pivot levels of 1.0745 – 1.0694 – 1.0597. Another target is the breakout point of the H4 Ichimoku Cloud at 1.0699 – 1.0692. Notably, the support zones on lower time frames are fortified by the support area on longer time periods at 1.0758 – 1.0693. The resistance is now formed by the key levels of the standard pivot point at 1.0842 and the weekly long-term trend at 1.0886. A firm hold above this price range may change the market balance.

***

GBP/USD

This image is no longer relevant

Higher time frames

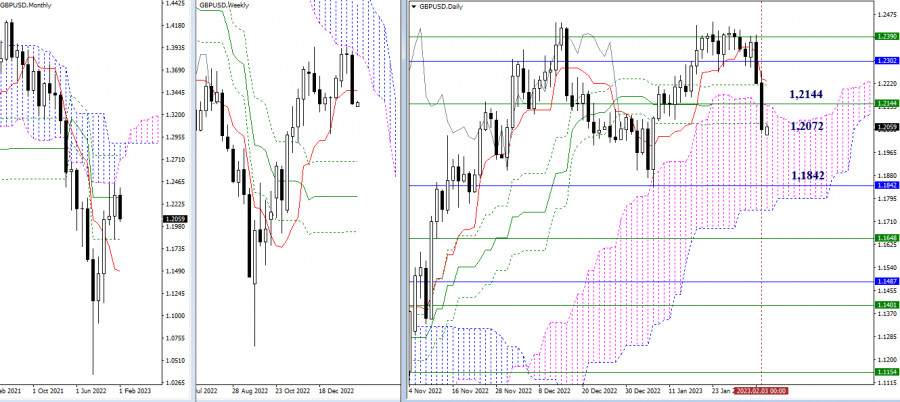
After trading for some time along the resistance level and the lower boundary of the weekly Ichimoku Cloud at 1.2390, the pair came under the control of the sellers. As a result, it closed last week below the key support levels of 1.2144 (weekly short-term trend) and 1.2072 (lower level of the daily Golden Cross). So, bears have entered the daily cloud and are confidently holding there. The levels left behind will now serve as new resistance that will protect the bearish trend. The next downward target is currently seen at the lower boundary of the daily Ichimoku Cloud and the monthly level of 1.1842.

This image is no longer relevant

H4 – H1

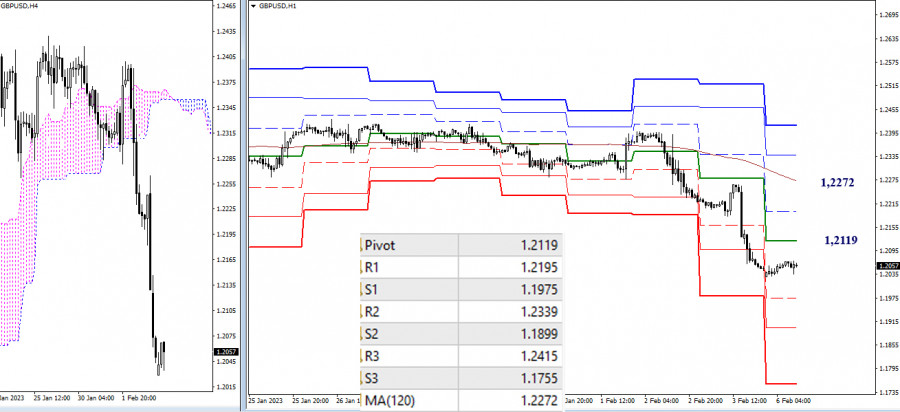
On lower time frames, bears are in control of the market. In the last few hours, the pair has been going through a correction. To deepen its current decline, the pair will need to pass the intraday support formed by the standard pivot levels of 1.1975 – 1.1899 – 1.1755. The key levels of the day are located at 1.2119 (daily central pivot level) and 1.2272 (weekly long-term trend). Consolidation above this range will change the market balance.

***

Technical analysis is based on:

Higher time frames – Ichimoku Kinko Hyo (9.26.52) + Fibo Kijun levels

Lower time frames – H1: Pivot Points (standard) + 120-day Moving Average (weekly long-term trend)

Evangelos Poulakis,
الخبير التحليلي لدى شركة إنستافوركس
© 2007-2025
حدد الإطار الزمني
5
د
15
د
30
د
1
س
4
ساعات
1
يوم
1
أسبوع
كسب عائد من تغيرات أسعار العملات المشفرة مع إنستافوركس.
قم بتحميل منصة التداول ميتاتريدر 4 وافتح أول صفقة.
  • Grand Choice
    Contest by
    InstaForex
    InstaForex always strives to help you
    fulfill your biggest dreams.
    انضم إلى المسابقة

المقالات الموصى بها

توقعات الفوركس 29/04/2025: اليورو/الدولار الأمريكي، الجنيه الإسترليني/الدولار الأمريكي، الذهب، الإيثيريوم والبيتكوين

روابط مفيدة: مقالاتي الأخرى متوفرة في هذا القسم دورة InstaForex للمبتدئين التحليلات الشائعة افتح حساب تداول مهم: يجب على المبتدئين في تداول الفوركس أن يكونوا حذرين للغاية عند اتخاذ القرارات

Sebastian Seliga 08:41 2025-04-30 UTC+2

التحليل الفني لحركة السعر اللحظية لأزواج العملات المتقاطعة AUD/JPY، الأربعاء 30 أبريل 2025.

مع ظهور نماذج الوتد المتسع المتباين والهابط على الرسم البياني لمدة 4 ساعات لزوج العملات المتقاطع AUD/JPY، على الرغم من أن حركة السعر تقع تحت المتوسط المتحرك الأسي (21) الذي

Arief Makmur 06:19 2025-04-30 UTC+2

التحليل الفني لحركة السعر اللحظية لأزواج العملات الرئيسية USD/JPY، الأربعاء 30 أبريل 2025.

على الرسم البياني لمدة 4 ساعات للزوج الرئيسي USD/JPY، يمكن ملاحظة أن مؤشر Stochastic Oscillator يشكل نمط القاع المزدوج بينما يشكل حركة سعر USD/JPY قمة أعلى، مما يعطي هذا التباين

Arief Makmur 06:17 2025-04-30 UTC+2

إشارات التداول للذهب (XAU/USD) ليومي 29-30 أبريل 2025: الشراء فوق $3,310 (21 SMA - 7/8 Murray)

في بداية الجلسة الأمريكية، يتداول الذهب حول مستوى 3,310، حيث يقع عند 21SMA وداخل نمط مثلث متماثل تشكل في 23 أبريل. من المحتمل أن نشهد تماسكًا في الأيام القادمة

Dimitrios Zappas 18:10 2025-04-29 UTC+2

إشارات التداول لليورو/الدولار الأمريكي ليومي 29-30 أبريل 2025: بيع تحت 1.1410 (مثلث متماثل - 7/8 Murray)

خطة التداول لدينا للساعات القادمة هي البيع تحت مستوى 1.1410 مع أهداف عند 1.1370 و1.1230. مؤشر النسر يعطي إشارة سلبية، لذلك نعتقد أن تصحيحًا تقنيًا قد يحدث على المدى القصير

Dimitrios Zappas 17:52 2025-04-29 UTC+2

توقعات الفوركس 28/04/2025: اليورو/الدولار الأمريكي، الجنيه الإسترليني/الدولار الأمريكي، الدولار الأمريكي/الين الياباني، مؤشر الدولار الأمريكي، الذهب والبيتكوين

روابط مفيدة: مقالاتي الأخرى متوفرة في هذا القسم دورة InstaForex للمبتدئين التحليلات الشائعة افتح حساب تداول مهم: يجب على المبتدئين في تداول الفوركس أن يكونوا حذرين للغاية عند اتخاذ القرارات

Sebastian Seliga 18:34 2025-04-28 UTC+2

إشارات التداول لليورو/الدولار الأمريكي للفترة من 28 إلى 30 أبريل 2025: بيع تحت 1.1370 (21 SMA - 7/8 Murray)

من ناحية أخرى، إذا ساد الضغط الهبوطي واستقر اليورو تحت مستوى 1.1370، فقد يُعتبر ذلك إشارة بيع مع أهداف عند مستوى 6/8 Murray الموجود عند 1.1230 وفي النهاية

Dimitrios Zappas 16:29 2025-04-28 UTC+2

إشارات التداول للذهب (XAU/USD) للفترة من 28 إلى 30 أبريل 2025: الشراء فوق $3,270 (21 SMA - 7/8 Murray)

في بداية الجلسة الأمريكية، يتداول الذهب حول 3,299 ضمن قناة الاتجاه الهابط التي تتشكل منذ 21 أبريل، مما يظهر تعافيًا فوق الدعم عند 3,270. على الرسم البياني H4، يمكننا رؤية

Dimitrios Zappas 16:25 2025-04-28 UTC+2

الذهب - نظرة عامة على التحليل الفني

في الأسبوع الماضي، قام المتداولون المتفائلون بتحديث الارتفاعات التاريخية وشكلوا أقصى حد جديد عند 3499.58. بعد ذلك، دخل الذهب في تصحيح هبوطي نحو دعم الاتجاه قصير الأجل اليومي عند 3346.45

Evangelos Poulakis 06:49 2025-04-28 UTC+2

USD/JPY – ملخص وآفاق

في الأسبوع الماضي، قام السوق بتحديث المستوى المنخفض، لكن البائعين لم يتمكنوا من مواصلة الحركة الهبوطية بشكل كامل. قد يكون ذلك بسبب أن المستوى المنخفض للأسبوع السابق (141.63) كان مدعومًا

Evangelos Poulakis 03:51 2025-04-28 UTC+2
لا تستطيع التحدث الآن؟
اطرح سؤالك في الدردشة.
Widget callback
 

Dear visitor,

Your IP address shows that you are currently located in the USA. If you are a resident of the United States, you are prohibited from using the services of InstaFintech Group including online trading, online transfers, deposit/withdrawal of funds, etc.

If you think you are seeing this message by mistake and your location is not the US, kindly proceed to the website. Otherwise, you must leave the website in order to comply with government restrictions.

Why does your IP address show your location as the USA?

  • - you are using a VPN provided by a hosting company based in the United States;
  • - your IP does not have proper WHOIS records;
  • - an error occurred in the WHOIS geolocation database.

Please confirm whether you are a US resident or not by clicking the relevant button below. If you choose the wrong option, being a US resident, you will not be able to open an account with InstaForex anyway.

We are sorry for any inconvenience caused by this message.